New in SSMS: Performance Dashboard built-in
Back in 2007, we released the Microsoft SQL Server 2005 Performance Dashboard Reports, which were designed to provide fast insight into performance issues from some newly created system views – DMFs (Dynamic Management Views). These were updated for SQL Server 2008 and later to SQL Server 2012, and while being very helpful they had a significant drawback – required separate download and install. This meant that when needed, most probably they were not installed in a specific SQL Server, and therefore were unusable when they were needed the most.
With the new SSMS 17.2, we are releasing the Performance Dashboard embedded as a built-in Standard Report. This means that it is available for any SQL Server instance starting with SQL Server 2008, without any extra downloads or running any extra scripts. Just connect to your server in SSMS and open the Performance Dashboard.
How to start it?
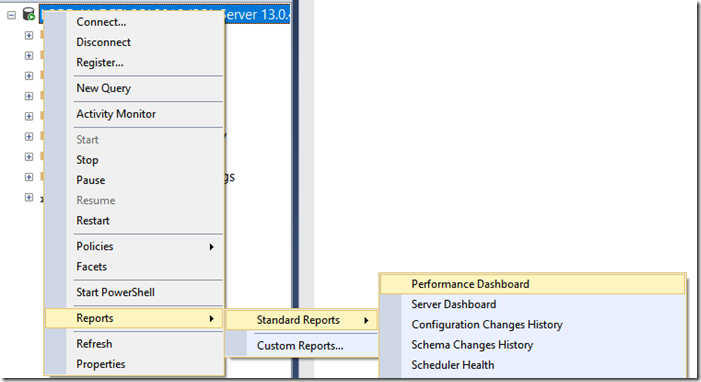
As seen below, just bring up the Reports context menu at the server level, and select the Standard Reports.
What to use it for?
The Performance Report allows a DBA to quickly identify whether there is any current performance bottleneck on the connected SQL Server. And if a bottleneck is found, easily capture additional diagnostic data that may be necessary to resolve the problem. Some common performance problems where the Performance Dashboard can help to solve include:
- CPU bottlenecks (and what queries are consuming the most CPU)
- I/O bottlenecks (and what queries are performing the most IO)
- Index recommendations generated by the query optimizer (missing indexes)
- Blocking
- Resource contention (including latch contention)
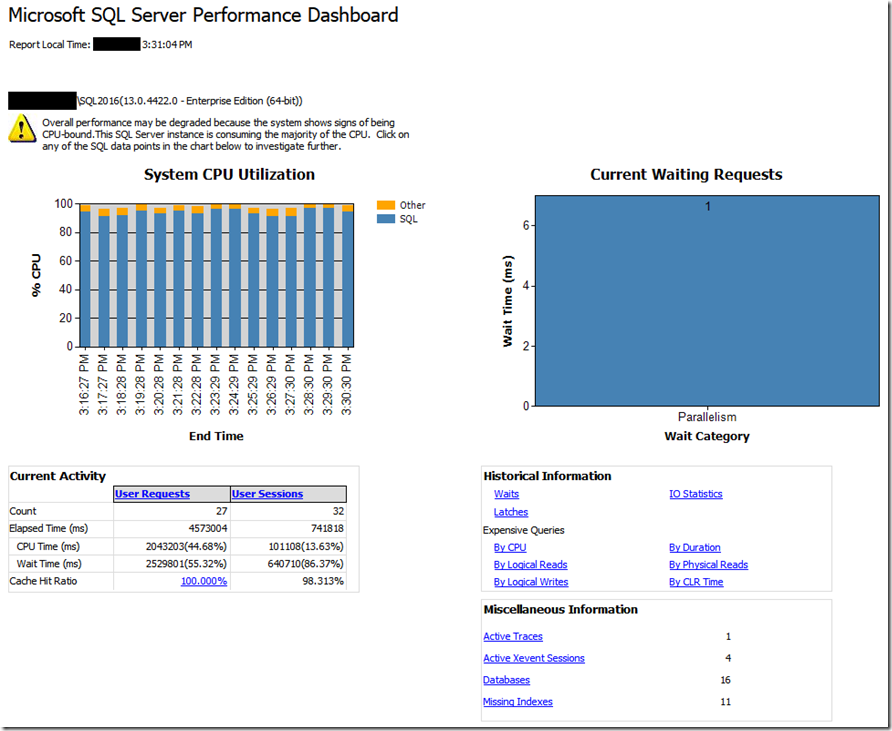
See below an example where a CPU bottleneck is present:
What has changed since the 2012 release?
Besides being completely self-contained in SSMS, we have made a few changes to improve usability:
- Under Historical Information section:
- Added wait categorization to Waits report.
- Filtered out all idle and sleep waits from Waits report.
- Added new Latches report.
- Under Miscellaneous Information, added a score column to the report. This report shows potential indexes that the query optimizer identified during query compilation. However, these recommendations should not be taken at face value.
- We recommend that only the indexes with a score greater than 100,000 should be evaluated for creation, as those have the highest anticipated improvement for user queries.
- Also, always evaluate if a new index suggestion is comparable to an existing index in the same table, where the same practical results can be achieved simply by changing an existing index instead of creating a new index. For example, given a new suggested index on columns C1, C2 and C3, first evaluate if there is an existing index over columns C1 and C2. If so, then it may be preferable to simply add column C3 to the existing index (preserving the order of pre-existing columns) to avoid creating a new index.
What permissions are needed to run the report?
This is aimed at sysadmin roles. Other roles require VIEW SERVER STATE and ALTER TRACE permissions.
Check out a demo of this and other SSMS features in the Tiger YouTube channel.
Pedro Lopes (@sqlpto) – Senior Program Manager
Comments
- Anonymous
August 07, 2017
Hi,Great this improvements. - Anonymous
August 07, 2017
Will these changes be pushed into the version available in the Tiger Toolbox? While having natively available in SSMS the centralized option provided by the SSRS version is also extremely useful- Anonymous
August 09, 2017
Hello Patrick, the Tiger Toolbox version is a community project that we maintain as a best-effort basis. Given the embedded reports are not RDL files, there's no timeline for it. I'm curious, given it's now embedded in SSMS and can be pointed to any SQL Server a given machine has access to, what is the use case for a centralized report?- Anonymous
August 15, 2017
The comment has been removed- Anonymous
August 15, 2017
Hello Phil, no standard report embedded into SSMS has a published standalone RDL. Thank you for the feedback that those are useful if published.
- Anonymous
- Anonymous
- Anonymous
- Anonymous
August 07, 2017
Great news with the New in SSMS Performance Dashboard.Three things:1) If I Click on a diagram bar in the Expensive Queries -CPU I get the details of a Query. BUT the Databases name field is only works if it’s a proc not a query.2) Can you please add a database name filter or the options to run Performance Dashboard on a specific database?3) Can I run SSMS Performance Dashboard from powershell, if so how?- Anonymous
November 09, 2017
Hello Peter, please open Connect item for your 2nd and 3rd items with details on the use cases. About the 1st, adhoc queries are not tracked in the context of a database and can originate from any database, while database objects such as stored procedures, triggers or functions are bound to a database context.
- Anonymous
- Anonymous
August 08, 2017
Thanks for this great functionality ! Just one enhancement please. For my clustered sql server the 'Current Waiting Requests' shows 1 and when I drill into it I see the one wait is for wait type 'SP_SERVER_DIAGNOSTICS_SLEEP'. I would think this is one of those system wait types that can be ignored. Would be good if this could be excluded from the displayed output.- Anonymous
August 08, 2017
Thank you for reporting this and for your overall feedback. We will add this sleep wait to the list of waits to filter out.
- Anonymous
- Anonymous
August 08, 2017
What permissions are required for a user to view this Performance Dashboard?- Anonymous
August 08, 2017
This report is targeted at sysadmins. Having said that, you need to have at least VIEW SERVER STATE and ALTER TRACE permissions. FYI, GRANT VIEW SERVER STATE TO user and GRANT ALTER TRACE TO user will do it.
- Anonymous
- Anonymous
August 09, 2017
It's great to see the performance dashboard included but what happened to the Utility Explorer? Has it gone for good, or is its absence just a temporary glitch?- Anonymous
August 22, 2017
Hello Scott, SSMS v16.5.3 was the last version of SSMS with UCP. The team's choice was to not include it starting with v17.0, based on very low usage/adoption to maintain it in a newer version.
- Anonymous
- Anonymous
August 14, 2017
WOW !!! Eager to use it. - Anonymous
August 18, 2017
Thanks - Anonymous
August 18, 2017
How does the Missing Index Report compute the score; what is the formula as of SSMS 17.2?If a stored procedure shows up in the Expensive Queries reports, the Representative Query column apparently lists the full T-SQL source of the stored procedure. We have some very long stored procedures and it is cumbersome to scroll past them. I wish this column defaulted to showing only the name of each stored procedure and a button to expand the source.- Anonymous
August 22, 2017
Hi ranta, the score is calculated using columns in the missing indexes DMV, specifically (User Seeks + User Scans) * Average Total User Cost * Average User Impact.About your feedback on columns, may I suggest you open a Connect item at connect.microosft.com so others that share your requirement can also vote up?Thanks- Anonymous
August 23, 2017
Thank you for the advice. I filed https://connect.microsoft.com/SQLServer/feedback/details/3139803 "SSMS 17.2 Performance Dashboard: cumbersome to scroll past a long Representative Query".
- Anonymous
- Anonymous
- Anonymous
August 21, 2017
I have just updated to version 17.2 and there is no sign of the performance dashboard report being included on the standard reports.- Anonymous
August 22, 2017
Hi Chris. Can you check if you have the right build? These reports are definitely there in 17.2 (which should be SSMS build 14.0.17174.0 or above) - you have to right-click at the instance level only. In SSMS the standard reports are contextual, so clicking on a database or any other nested level doesn't bring up the Perf Dashboard.
- Anonymous

