Guest Post - Automated Builds–Why They’re Absolutely Essential (Part 2)–Colin Dembovsky
Automated Builds–Why They’re Absolutely Essential (Part 2)
In my previous post I wrote about why you should be doing automated builds in general terms. In this post I’ll show you how TFS’s automated build engine gives you consistency and quality in your build processes. There are other build engines, but if you’re using TFS for source control (and/or test management and/or lab management and/or work item tracking) then Team Build makes the most sense as a build engine since it ties so many other parts of the ALM spectrum together.
TFS Team Build uses Workflow Foundation as the engine underneath the build. When you create a Team Project you get a few workflow XAML files out-the-box. For this post I’ll primarily discuss features of the DefaultTemplate11.1.xaml (the default build template).
Environment
When you configure a Build Agent, you install it on a build server. Ideally this is some Virtual Machine that is “clean” – the only things installed on the machine are the things that you need to compile (and test) your code. No rogue libraries or experimental settings – just a clean, controlled environment.
Installing the build agent is a snap – mount the TFS install media and install TFS. Then run the Build Configuration wizard and connect to a build controller (which can reside on the build machine if you want).
Labelling Sources During a Build
The build agent checks out the latest version of source control when it starts the build. As it does so, by default it labels the code that it checks out with the build name. This means that you can get the exact point-in-time code that the build used to compile, test and package. To see the labels, open the Source Control Explorer, find the folder that your build workspace is configured to download (in the Sources section of the build workflow), right-click and select “View History”. Then click on the Labels tab.
In the above picture you can see the build reports on the left, and the labels for the root folder of the build workspace on the right.
If you don’t want the build to label the sources on each build, then go to the Process tab of your build definition, expand the Advanced parameters and set “Label Sources” to false.
Perform Code Analysis During a Build
Most of us developers know we should be doing code analysis, but few teams that I work with actually do it. Most of the time it comes down to the fact that it’s hard to monitor. However, if you include code analysis as part of your build, you’ll easily be able to track Code Analysis over time.
If you have particular projects that you care about and don’t want to run Code Analysis on all projects, then you can configure that in the Build. The default build template sets “Perform Code Analysis” to “AsConfigured” which means if a project is configured to do code analysis on build, then it does so.
Of course you can set the Code Analysis to “Never” or “Always” too.
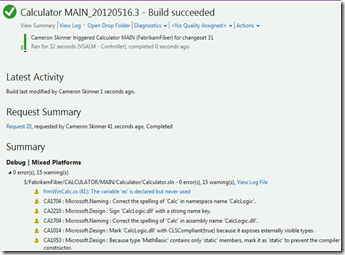
And as easy as that you now have Code Analysis as part of your build process:
Layer Validation
If you’ve got Visual Studio Ultimate, you’ll be able to draw Layer Diagrams. These diagrams allow you to visualize (and validate) layering within your architecture. Team Build can validate layering when building – all you have to do is right click your modelling project (that contains your layer diagrams) in the Solution Explorer, select Properties and set the “Validate Architecture” property to true.
As long as this project is part of the solution(s) being built, you’ll get layer validation as part of your build.
Oh dear – someone broke our layering!
Symbols
You should never deploy pdb files (symbol files) to production environments. But there are times when you’ll need the symbols files – for example remote debugging, for IntelliTrace or for Manual Test Coverage (see below). Team Build effortlessly publishes your symbols to a network share and indexes them for you, so you never have to think about them or hunt for them again.
Configuring Symbols and indexing on a build – the build creates a folder structure, so just supply the root folder and the build takes care of the rest.
Unit Testing and Code Coverage
Having a automated build without unit tests is like brushing your teeth without toothpaste. Once you’ve got a build in place, add unit tests and code coverage. This will increase the quality and consistency of your releases exponentially.
So let’s assume you have unit tests. You can easily configure Team Build to run the tests and perform code coverage. Set the automated test settings (you can have multiple) appropriately. By default the discovery filter is **\*test*.dll (which is any dll with the word “test” in it in any subdirectory). Click on “Edit” to enable Code Coverage and you’re done. I’ve even configured a build engine to run QUnit js files to test JavaScript in my web projects! Of course you can add category filters too if you want to filter which tests the build should be running.
Besides being a metric for each individual build, the pass/fail rates and coverage percentages go into the TFS Warehouse so that you can report off them and trend them.
If you’re not using the MSTest framework and you’re using nUnit or XUnit or some other framework and you have a corresponding Test Adapter in VS for running your unit tests within VS, then make sure you install the same Test Adapter on your build machine to enable it to run those tests during the build.
This build output shows a failed test.
That’s better – a 100% pass rate. Looks like the coverage is a little on the low side though…
Code Coverage for Manual Tests
At present this only works for Web Applications running in IIS. Get your testers to run test cases out of Microsoft Test Manager (MTM) against your test servers, and then enable the “Code Coverage” diagnostic adapter. You’ll have to tell it where to find the symbols files (which you hopefully configured on your build anyway) and you’re good to go.
Setting the Code Coverage diagnostic adapter (and the path to the symbols) in the Test Settings section of a Lab Environment.
The great thing about Team Build is that the manual code coverage is fed back onto the build report as testers execute their manual tests. Each time a manual test run is completed, the build report is updated.
This build report has been updated to show an additional test run (the manual test run) and the coverage has been merged into the total coverage (so it’s showing total unit test plus manual test coverage).
Build Reports – or what the heck is in this build?
Get your developers into the habit of associating checkins with work items. By default, the build lists all associated checkins between “good builds”. (The last good build is the last build that was successful – no compiler errors or test failures). If those checkins are associated with work items, the work items get associated with the builds too. That means that you can look at the build report and quickly answer the question, “What work is included in this build?”. This works for “direct” associations, such as when a developer checks in code against a Bug, but also “indirect” – when a developer checks in against a Task, the Tasks parent Product Backlog Item (or User Story) is also associated with the build.
Here we can see that Bug 82 was fixed in this build. We also see that Task 84 of PBI 83 is in this build.
Unfortunately this won’t work out-the-box for merges. If you queue a build that has only merges as changesets, the only changesets you’ll see will be the merges themselves. Never fear though – I created a custom build task that pulls in the merged changesets and work items into the build report. You can get it here.
Found In and Integrated In – Tracking Bugs Effectively
If you’ve got a build, and your testers specify that build number as the build they are testing, then any bug logged during testing has it’s “Found In” field automatically set. When you fix the bug and check it in, the Integrated In field is set so you know which build the bug was fixed in.
The System Tab of the default Bug work item: the “Found In” field gets populated automatically when logging a bug from MTM (where the build under test is specified) and the “Integrated In” field gets populated automatically when you resolve the bug during checkin.
Test Impact Analysis
Let’s say you have 100 manual tests. You run them all successfully. The developer then changes some code. Which tests should you run again? Ideally, all of them – but you may not have time to run all of them. So Team Build narrows down the list by doing test impact analysis. When you enable this diagnostic adapter in MTM, TFS builds a map of test vs code – it tracks which code is hit for each test the tester is executing. Then on the next build, for each passed test case, TFS does a lookup to see if any tests hit the code that changed since the last build. Each test that is “potentially impacted” is flagged during the build so that you can test is again to make sure the changes didn’t break the code. Of course TFS assumed you’ll re-run failed tests, so this only works against passed test cases.
Two tests were impacted by changes to the code – clicking on the “code changes” link opens details about what methods changed.
Build-Deploy-Test Workflow
I won’t go into any details on this workflow, but you get a LabDefault.xaml template out-the-box when you create a Team Project. This build doesn’t compile code – it takes the output of another build (TFS or even another engine), allows you to specify scripts that automate deployment to a Lab Environment (that you’ve set up using MTM’s Lab Manager) and even run automated tests, which could include manual test cases that you’ve converted to Coded UI Tests.
Metrics
I’ve mentioned that the build data go into the TFS warehouse – so you can see test results, coverage and code churn over time. Then you can slice-and-dice and create dashboards and reports.
The out-of-the-box Build Summary report.
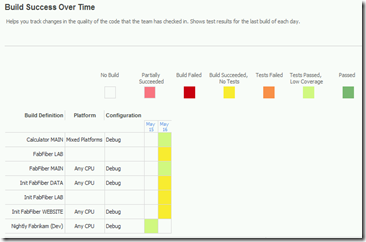
The out-of-the-box Build Success Over Time report.
Some of the build-specific measures available when you pivot against the TFS Cube from Excel.
Summary
There are other build engines that you can use (such as Hudson or TeamCity or Jenkins). Where they cannot compete with TFS is in the rich integration you get into work items, source control, lab management, testing and reporting. And you get most of it for free – out-the-box. In short, if you want to take a quantum leap in consistency and quality, you need to get building! The small investment up-front will be well worth it in the long run. And you’ll be able to sleep at night…
Happy building!
Colin Dembovsky is a senior ALM Consultant for Imaginet based in East London, South Africa. After completing an MSc in Computer Science at Rhodes University, he worked as a developer (first in Linux using C++ and moving to .NET and C#) and later systems architect. He left development work to start ALM consulting, and has been an ALM MVP since 2011. He is passionate about helping teams improve the quality of their software, and do it more efficiently. Besides consulting and training, Colin is a frequent guest speaker and regularly blogs at https://colinsalmcorner.blogspot.com . When he is not working on a TFS server somewhere, he is playing guitar or mandolin and recording in his home studio, or entertaining his wife and 2 kids.


