Did you know... You can display any toolbar at any time - #138
Right-click anywhere on the toolbar area, either on a toolbar itself or in the unused portion of the toolbar space. You’ll be presented with a context menu of all available toolbars. Click on any toolbar to have it appear.
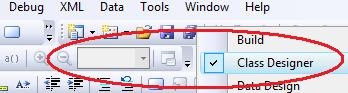
Note that all buttons may be disabled (as shown in the picture) if you are not in the right "environment context," meaning that you don’t have the right window or editor or designer showing to enable the buttons (hence why it was probably hidden to begin with).
But play, experiment, and see if this helps.
Comments
Anonymous
January 28, 2008
Hi, Sara! Thank you for your daily tips. I have a question. When debugging, I get a window that give a list of all the breakpoints, from there I can disable, enable, delete or set a breakpoint. My question is: how can I get this breakpoint window in no debugging mode? let's say, while I'm coding. Is it possible? Maybe you are wonder why do I want this window in other mode than debugging, but I find this little window very useful. I know that I can delete, enable or disable all the breakpoints from the debug menu, but I like to disable just one, or look for the one I need. I also know that there are the bookmarks (and I use them, too) but... well... bookmarks don't stop your application while running... do they? :b I hope you can help me (and if this is a silly question, forgive me) Thank you!!Anonymous
January 28, 2008
The Debug toolbar has a Breakpoints button (the keyboard shortcut is Ctrl + Alt + B), which shows the breakpoint window. You can then dock it where you want, etc... HTHAnonymous
October 20, 2008
The comment has been removed