Hinweis
Für den Zugriff auf diese Seite ist eine Autorisierung erforderlich. Sie können versuchen, sich anzumelden oder das Verzeichnis zu wechseln.
Für den Zugriff auf diese Seite ist eine Autorisierung erforderlich. Sie können versuchen, das Verzeichnis zu wechseln.
Power BI - Using web pages as a Power BI data source to build your personalized MSDN/TechNet and PowerBI.com forum dashboard
The following example shows how to leverage web pages as a Power BI data source and how to use the "publish to web" functionality to embed the dashboard into your blog (or other web site). In this example, I will build a dashboard that shows my live statistics from answering questions in both the PowerBI.com community forums (web data source #1) and the MSDN/TechNet community forums (web data source #2).
Selecting the web pages to use as a data source
I have been answering questions in the MSDN forums for over 10 years and have recently started getting more involved in the PowerBI.com community forums. In order to have a single place to view my involvement metrics, I decided to build a dashboard using my profile page from each of the forums as the web page data source. In my specific case, the links are:
MSDN: https://social.msdn.microsoft.com/Profile/v1/samuel%20lester%20-%20msft
Power BI : https://community.powerbi.com/t5/user/viewprofilepage/user-id/3429
Connecting to the data source
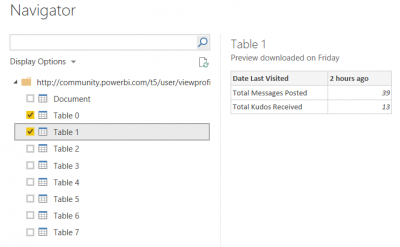
In Power BI Desktop, click on "Get Data", select "Web", and provide the first link above into the web link field. Power BI Desktop will connect to the web page and attempt to discover any table elements in the data source, which can then be automatically imported into your data model and used in the reports. You will see something that looks like the following:
In each of the links, data is stored in the different tables. Ex: In the Power BI source, Table 1 is latest posts by user, Table 2 is public stats, Table 3 is My Kudoed posts, etc. Select the data that you want to include in your reports and load the data. Notice that some of the tables, such as Table 1 in the image above may need to be transformed using the pivot functionality depending on how you want to display the data.
Building the dashboard
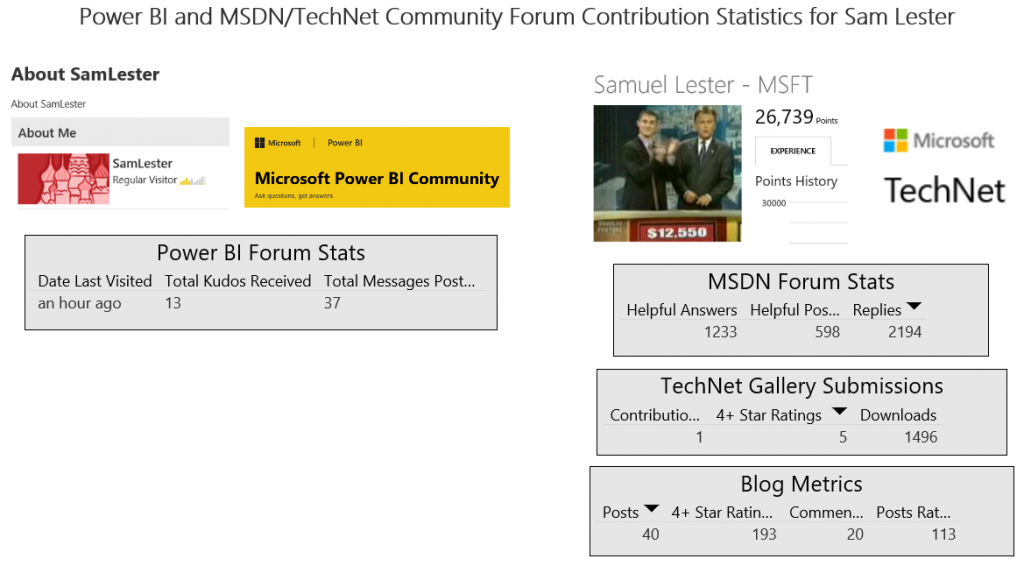
After connecting to both links and loading the data, you can build the dashboards however you like. A quick example is the one below where I have added some still images from the site for data that is not available through the web data source (ex: the AboutMe image, Power BI logo, TechNet logo, and MSDN profile picture):
Upload and view the dashboard in PowerBI.com
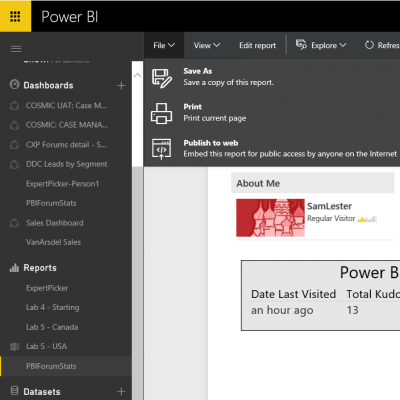
After creating the dashboard, click on the Publish button to publish to your PowerBI.com account. Upon successful upload, you can click the link to go straight to the report. From the report, click on File -> Publish to web to obtain an <IFRAME> link to embed into your web page (such as this blog above).
After obtaining the "publish to web" link, you can then embed it in your web application to include the live dashboard. In the MSDN blog platform, it is an easy as switching to HTML mode and pasting in the HTML code created through PowerBI.com.
Enjoy!
Sam Lester (MSFT)
Comments
- Anonymous
April 26, 2017
The comment has been removed- Anonymous
April 26, 2017
Hi Dinup, that web page appears to be designed as a paginated report as to only show 50 rows per page. It looks like they have an export to text option that might allow you to export the full list for use in Power BI.Thanks,Sam
- Anonymous


