Understanding HTTP Flow with Netmon 3 - By Yuri Diogenes
1. Introduction
One of the most common protocols that we need to deal with these days is the HTTP Protocol. This is not only a privilege of Internet users, there are a lot of Intranet users that also use this protocol for internal transactions.
This post will show how to use Network Monitor 3 to better understand HTTP traffic and also to help you troubleshooting HTTP traffic.
2. HTTP Components
On HTTP we pretty much have two messages: HTTP Request and HTTP Response. The picture below shows an example of these messages:
Figure 1 – HTTP Messages
Here is a brief explanation of the main components of a message:
- HTTP Version: the http version in use by the message (ex.: HTTP 1.0 or HTTP 1.1).
- Method: this is about the action that the client is requesting to the server (ex.: GET and POST).
- Status Code: this code describes what happened on that transaction (ex.: 200, 301 and 407).
- Reason: complement to the status code (ex.: OK, NOT OK).
- Headers: the content of the header will depend on the version of the HTTP. For instance, HTTP/1.1. has some headers that needs to be present for the method in use (request or response).
- Body: some messages will contain the body, which is the data itself. Some other messages will have a blank line.
Based on this brief explanation about the main components of a message, let’s see how NetMon 3 can help us tracking down a HTTP conversation.
3. Understanding HTTP Messages using Netmon3
On this example the server is trying to access the website www.sysinternals.com. This server (Windows Server 2003) is behind a Proxy (ISA Server 2004) and using Integrated Authentication. All the traffic was captured from this server while was accessing this web site.
To help understand the HTTP conversations add the columns “HTTP is Request” and “HTTP is Response” . Those columns will have a number 1 in the column if this sentence is TRUE. This will help to identify what HTTP message was in use at that time.
Figure 2 – Choosing Columns.
For this example is quiet easy to identify the traffic, however on a real world scenario it might be difficult to locate the packet that has the URL request that you want. You might say, “Well, let’s create a filter for this request.” The thing is, if you create a filter for this request you will see only one packet requesting for this URL and this is not what we want here.
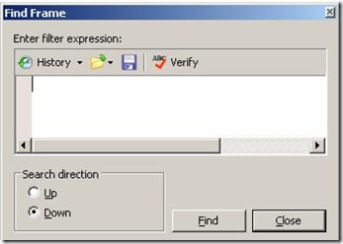
There is one cool feature on Netmon3 that allows you to use a filter to find a packet. To use this feature you need to click on the menu Frames than click in Find (or click Ctrl+F). The following window will appear:
Figure 3 – Find Packet based on a filter.
In this case I want to find a packet that matches with the following criteria:
Contains(http.request.URI,”sysinternals.com”)
After typing this and clicking Find the packet that matches with this request is selected as the current frame.
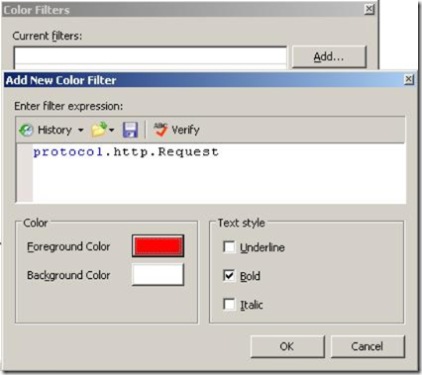
To make even easier to read the trace we can also change the color for the HTTP packets. This will allow you to quickly identify the HTTP traffic. For this example we will set the HTTP Request in Red and the HTTP Response in blue. Follow the steps below to configure that:
- Click in Filter.
- Click in Color Filters.
- Click in Add and type the query specified on the figure below:
Figure 4 – Color Filter feature.
- After type this query click, the color (red) and the Bold style click OK.
- Click in Add again and now type the following query: protocol.HTTP.response
- Choose the color blue and leave it bold
- Click OK again.
Here an example of how it will look after you apply the color filter:
Figure 5 – Frame summary after applies the filter.
Now we can close the Find Dialog window and look at the packet. Here is the HTTP part of the packet:
 - Http: Request, GET https://www.sysinternals.com/
- Request:
  Command: GET
  - URI: https://www.sysinternals.com/
    + Uri:
    ProtocolVersion: HTTP/1.0
    Accept: image/gif, image/x-xbitmap, image/jpeg, image/pjpeg, */*
    Accept-Language: en-us
    UA-CPU: x86
    Proxy-Connection: Keep-Alive
    UserAgent: Mozilla/4.0 (compatible; MSIE 6.0; Windows NT 5.2; SV1; .NET CLR 1.1.4322)
    Host: www.sysinternals.com
    HeaderEnd: CRLF
As you can see, this is a HTTP Request message and some of the components of the messages previously explained appear on this packet. Let’s check the answer for this packet:
 - Http: Response, HTTP/1.1, Status Code = 301
  - Response:
    ProtocolVersion: HTTP/1.1
    StatusCode: 301, Moved permanently
    Reason: Moved Permanently
    Via: 1.1 SRVISA
    Connection: Keep-Alive
    Proxy-Connection: Keep-Alive
    ContentLength: 31
    Date: Sun, 26 Aug 2007 15:05:10 GMT
    Location: https://www.microsoft.com/technet/sysinternals
    ContentType: text/html
    Server: Microsoft-IIS/6.0
    XPoweredBy: ASP.NET
    Set-Cookie: ASPSESSIONIDCCRASDTB=OKKIMCCDOMFAEPIPJCLNPEBN; path=/
    Cache-control: private
    HeaderEnd: CRLF
    + payload: HttpContentType = text/html
Note: it is important to mention that in my lab there were no multiple streams involved. Which make it easier to track it down the answer, since it is the next packet in the sequence.
This HTTP Response message is really important to emphasize one particular point, which is the Status Code.
The status code on this answer is 301. This number itself already says what is going on in this answer. It is important to know at least the meaning of status code based on the number range. The ranges are:
| Status Code | Means |
| 200 – 299 | Success |
| 300 – 399 | Redirection |
| 400 – 499 | Error on the client side |
| 500 – 599 | Error on the server side |
The netmon3 parser for HTTP has the main codes already defined. If you click on the Parser Tab, click on Protocols and HTTP, you will see on the right panel those definitions.
Figure 6 – Netmon3 HTTP Parser.
You also can view this code on the Table object on the Parser tab, as showed below:
Figure 7 – Table View.
Since this is a redirection answer, the field “location” has the place where the page is now located. This is presented to the client (requester) that based on that will send another HTTP Request for this URL.
4. HTTP with Netmon3 Conversation
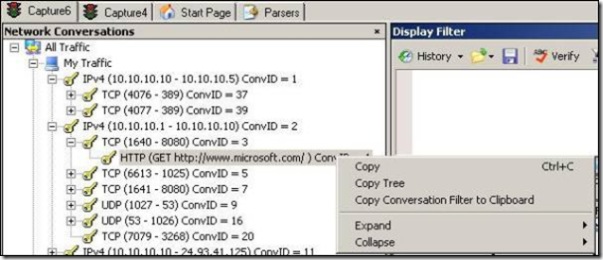
The conversation feature on netmon3 allows you to view the frames aggregated on the same conversation. For this next example, let’s see the frames aggregated for the HTTP request for the URL www.microsoft.com:
Figure 8 – Filtering by conversation.
Clicking on the conversation tree filters out packets based on the HTTP traffic automatically. This can help to understand the whole conversation that client and server are having during this access. Another way to customize this filter is right clicking on the conversation and chooses the option Copy Conversation Filter to Clipboard” as showed in figure 8. Remember that all filters are applied in combination with the current node that is selected in the Conversation Tree. Be sure to click on the root of the tree if you don’t want the frames to be qualified further by the conversation tree.
Looking at this conversation we can see another status code that means there was an error on the client side:
 - Http: Response, HTTP/1.1, Status Code = 407
- Response:
  ProtocolVersion: HTTP/1.1
  StatusCode: 407, Proxy authentication required
  Reason: Proxy Authentication Required ( The ISA Server requires authorization to fulfill the request. Access to the Web Proxy filter is denied. )
  Via: 1.1 SRVISA
  - ProxyAuthenticate: Negotiate
  WhiteSpace:
  AuthenticateData: Negotiate
  - ProxyAuthenticate: Kerberos
    WhiteSpace:
    AuthenticateData: Kerberos
  - ProxyAuthenticate: NTLM
    WhiteSpace:
    AuthenticateData: NTLM
  Connection: Keep-Alive
  Proxy-Connection: Keep-Alive
  Pragma: no-cache
  Cache-Control: no-cache
  ContentType: text/html
  ContentLength: 4106
  HeaderEnd: CRLF
  + payload: HttpContentType = text/html
The reason why this request was considered an error on a client side is because the ISA requires authentication and the Internet Explorer on the first attempt to access the web site did not send the user credentials. After the response from the server, and depending on the browser and on the configuration, the client will use either NTLM or Kerberos to send another packet with the credentials.
5. General Information
There are many commands that you can use to obtain more information about your HTTP traffic using netmon 3. Let’s see some of them:
| Filter | Explanation |
| contains(Http.Response.StatusCode,"301") | Show all HTTP packets where the Status Code is 301 |
| Property.HttpIsRequest | Show all HTTP Request packets |
| Property.HttpPragma | Show all HTTP messages that cannot be cached. More information about the Pragma Field, see the HTTP Field definition. |
Yuri Diogenes
Security Support Engineer – ISA Server Team
Comments
Anonymous
January 01, 2003
While browsing on the technet portal for details on Netmon drivers for Vista, happened to visit a blogAnonymous
January 01, 2003
You have to modify TCP.NPL and add the port. Please reference this BLOG for more info: http://blogs.technet.com/netmon/archive/2006/10/04/NPL-1320-The-Power-Behind-the-Parsers.aspx. Thanks, Network Monitor TeamAnonymous
January 01, 2003
What port is the HTTP traffic on? By default the NPL for NM3 uses ports 80 and 8080. But you can add other ports if the app is using a non-standard HTTP port. Thanks, Network Monitor TeamAnonymous
January 01, 2003
This week's collection of interesting links! Understanding HTTP Flow with Netmon 3 - Interesting articleAnonymous
January 01, 2003
The comment has been removedAnonymous
January 01, 2003
Hi, a tricky question: is there any way to sniff packets intramachine ? I mean process-to-process, e.i. when browser and web server are on the same host. Very useful while developing, as the last chance when things go wrong. I have XP and MS loopback installed on 192.168.02. but I can't see any packet over there. All flow over the wireless on 192.168.0.3 From net info (e.i. Ethereal world) I understand that I definitely cannot sniff intramachine in the Windows world, but who knows with Netmon ...Anonymous
January 01, 2003
thanksAnonymous
January 01, 2003
This is not possible today. We've been looking at this as a feature for future versions of NM, but we have not solid plans to implement this soon. There are ways of getting this information with Vista and above OS's so we may be able to find a way to leverage those methods with the API available in NM3.2 When we have time to investigate this further we might be able to provide a separate tool to capture local traffic. Thanks, Network Monitor TeamAnonymous
January 01, 2003
Ah, I suspected that. Indeed port is 8180. I tried to spot where I could set it up, no success. How/where do I add non-standard ports to a protocol ?


