It’s perfcounter week on the NDIS blog!
Actually every week is perfcounter week.
Performance counters are an essential tool for devs, ops, … and marketing. Yet they’re often not well understood. Fortunately, under the hood, performance counters are very simple: a perfcounter is just a number that counts things.
Before we get too far along, let’s agree on a bit of terminology:
A counter is a single measurement, like the number of interrupts per second.
A counter set is a group of related counters, like a group of 9 counters relating to TCP/IP. The CLR calls this a category name, and some Win32 APIs call this a performance object. They all refer to the same thing. I’ll stick with the counter set term on this blog.
A counter instance is a specific thing that can be measured, like a network adapter.
Conventionally, you can specify a counter using the counter path notation. The formal grammar is documented here, but most commonly in Networking, you’ll use the subset that looks like this:
Counter Set ( Counter Instance )\ Counter
So for example, Network Interface(BitBlaster 2000)\Bytes Sent/sec belongs to the Network Interface counter set, targets the BitBlaster 2000 instance, and measures the Bytes Sent/sec counter.
Counters in a GUI
Enough terminology; let’s do things. If you’ve used perfcounters before, you’ve probably come across Performance Monitor, aka perfmon. You can use this built-in tool to rummage around and visualize the various perfcounters. It’s great if you don’t quite know which counter you’re looking for, or if you need a quick overview of what some counter is doing. Here’s how I use it:
- Launch perfmon.exe.
- In the tree on the left, select Performance Monitor to get to the graph.
- In the graph’s toolbar, click the Delete button (it looks like a red X) to remove any pre-added counters. We’ll add our own.
- Then click the Add button (it looks like a green +) to add more interesting counters.
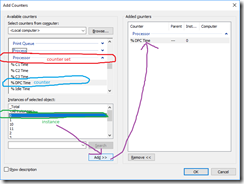
- In the dialog that appears, the upper-left quadrant shows all counter sets. If you expand one of the dropdowns inside a counter set, you can see an individual counter. Once you select an individual counter, you can see all applicable counter instances in the lower-left quadrant.
- Select a counter instance, then click the Add button to add the counter to the list of counters to monitor.
- Once you’ve added all the counters you like, click OK.
That will look like this:
To make the graph look right, you may have to fiddle with the scale a bit. Right-click on the counter at the bottom of the main window, select Properties, and change the Scale dropdown on its properties page.
Counters in PowerShell
Perfmon is great for high-level explorations, but you’ll eventually run up against its limitations. For example, it won’t send you an email if a counter goes out of tolerance. For the most flexibility, we need to go beyond a GUI.
Performance counters have been around for a while, so there are plenty of APIs, libraries, and tools you can choose from. I will use PowerShell for illustration, but you can use whatever API you prefer. Generally the concepts exposed in PowerShell will map onto any API.
Let’s poll a counter from PowerShell:
PS C:\> Get-Counter '\Processor(0)\% DPC Time'
Timestamp CounterSamples
--------- --------------
6/4/2017 10:14:10 \\jtippet-d\processor(0)\% dpc time :
1.56111154738975
The counter values come back as real numbers, so you can perform all the usual arithmetic on them. For example, you can check if the counter value exceeds 10%:
Get-Counter '\Processor(0)\% DPC Time' -Continuous | % {
$percentDpcTime = $_.CounterSamples[0].CookedValue
if ($percentDpcTime -gt 10) {
Send-MailMessage -To 'me@example.com' -Subject 'Alert' -BodyAsHtml "% time at DPC: $percentDpctime"
} }
(Don’t actually build a production monitoring system like this – there’s off-the-shelf software that has way more features.)
Now that we have some of the basics down, next time we’ll take a look at the goodies you can use to measure the heartbeat of the Windows network stack.
Comments
- Anonymous
June 05, 2017
How can perfcounter be used in marketing?- Anonymous
June 05, 2017
One feature request we had: show me exactly how many cycles my LWF uses, and also how many cycles my competitor's LWF uses... so we can brag about our perf. I declined the feature, on the basis that I don't want to get involved in marketing claims.
- Anonymous
