SQL Server 2016 Query Store
Editor’s note: The following post was written by Data Platform MVP Sergio Govoni as part of our Technical Tuesday series.
This article allows us to focus on a new feature of SQL Server 2016 known as Query Store. We will talk about performance issues related to the query plan choice change and how the Query Store can help us to identify queries that have become slower.
Introduction
Have you ever experienced your system slowing down or completely down? What happens? Everyone is waiting for you to fix the problem as soon as possible! The Boss is over your desk! Have you ever experienced upgrading an application to the latest version of SQL Server and facing an issue with plan change that slows your application down? Query plan choice change can cause these problems.
A performance problem related to the system database tempdb is not as hard to fix as a problem related to a query plan changes. You know, query plan changes give you more and more problems. As far as the tempdb is concerned, you can move it into a faster hard-drive or you can increase the number of the tempdb files, but when you have to find the slow running queries you have to figure out why they are slow!
Detecting and fixing problems you face for slow running queries takes you a long time because you have to look into the plan change as well as the lock occur and a question grows in your mind: What was the former plan like? So you try to find an answer for this question, but, has the Data Collector been activated on the server? If the Data Collector hasn’t been activated the only tool you have to investigate slow running queries is the plan cache, but it may not be suitable for troubleshooting. When memory pressure occurs on the server, the queries you are finding could be already gone away from the cache. Finally, when you have the issue on your hands, can you modify the query text? If you cannot, do you know the system stored procedures to create and manage the Plan Guide?
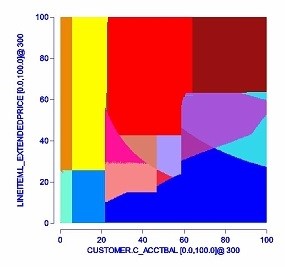
Supposing you are given a query with two predicates on it, one predicate has the highest selectivity, which plan is the best? Supposing you are given a query with two joint tables, for example you have the table A Joined to the table B. Which is the best way to implement the Join? A Joined to B or the opposite? Imagine now a query that has 80 joint tables. Each color in the following picture represents an execution plan generated and evaluated by the Query Optimizer for the same query. In practice we have hundreds or thousands possible plans for a query with medium complexity.
Picture 1 – Execution Plans (Projects PICASSO: https://dsl.serc.iisc.ernet.in/projects/PICASSO)
SQL Server Query Optimizer considers many plans, but when your data changes, it might select a different plan. Usually when it crosses a boundary, performance is approximately the same, but sometimes, the actual performance is visibly different.
What does the query store do for you?
The Query Store stores all the plan choices and related performance metrics for each query, it identifies queries that have become slower recently and it allows DBAs to force an execution plan easily! If you force an execution plan for a particular query, it makes sure your changes work across server restart, upgrades, failover and query recompiles.
How the Query Store captures data?
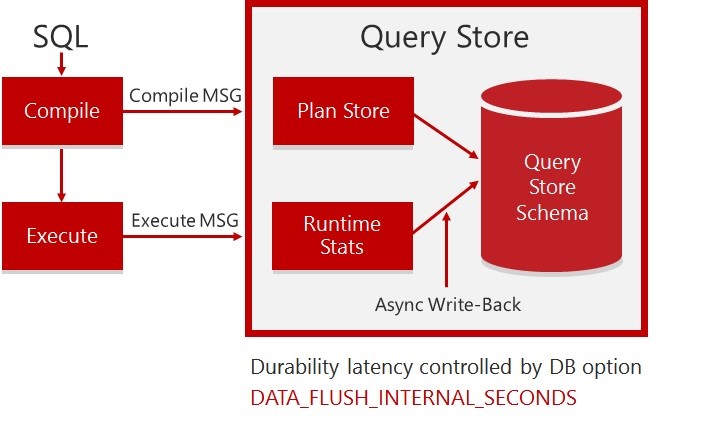
Every time SQL Server compiles a query, a compile message comes into the Query Store and the execution plan of the query is stored. In the same way, when a query is executed, an execute message comes into the Query Store, the runtime statistics are stored into the Query Store after the query has been executed. Query Store aggregates the information according to the time granularity you have chosen, the aggregation will be done in memory (because we don’t want to kill the server) and then, based on the database option DATA_FLUSH_INTERNAL_SECONDS, aggregated data will be stored on disk in a background asynchronous way like the checkpoint mechanism.
Picture 2 – How the Query Store captures data
I have just told you that the aggregation is done in memory and not on the disk, so suppose an unexpected shutdown occurs, how many in memory data would be lost? If you keep a smaller number of data in memory, you will have bigger IO cost and a smaller number of information will be lost in case of an unexpected shutdown, otherwise, if you keep a bigger number of data in memory, you will lose a larger number of data in case of an unexpected shutdown, but you will have smaller IO cost. This setting is your choice! The important thing is that you have the possibility to choice! If you want to see data captured by the Query Store, you need a tool that combines both In-Memory and On-Disk statistics. Each DMV related to the Query Store, joined In-Memory and On-Disk data. For example, the sys.query_store_runtime_stats table valued function groups In-Memory and On-Disk data in a unified place, so you can use it your scripts or in your application.
Bear in mind, when memory pressure occurs on the server, some data In-Memory will be flushed to the disk in order to release the memory for others.
Let’s talk about how the Query Store interprets the query text. The query text is the characters’ section between the first character of the first token and the last character of the last token of the statement. Comments and spaces, before or after, don’t make any difference in the interpretation of the query text. On the contrary, what really counts are the comments and the spaces inside the query text. This logic is adopted to determine the differences among texts, each unique query text is stored just once in the DMV sys.query_store_query_text. The most important columns in this DMV are query_text_id and statement_sql_handle. In particular, query_text_id is used to identify a query on which you force the query plan.
Query Store DMV overview
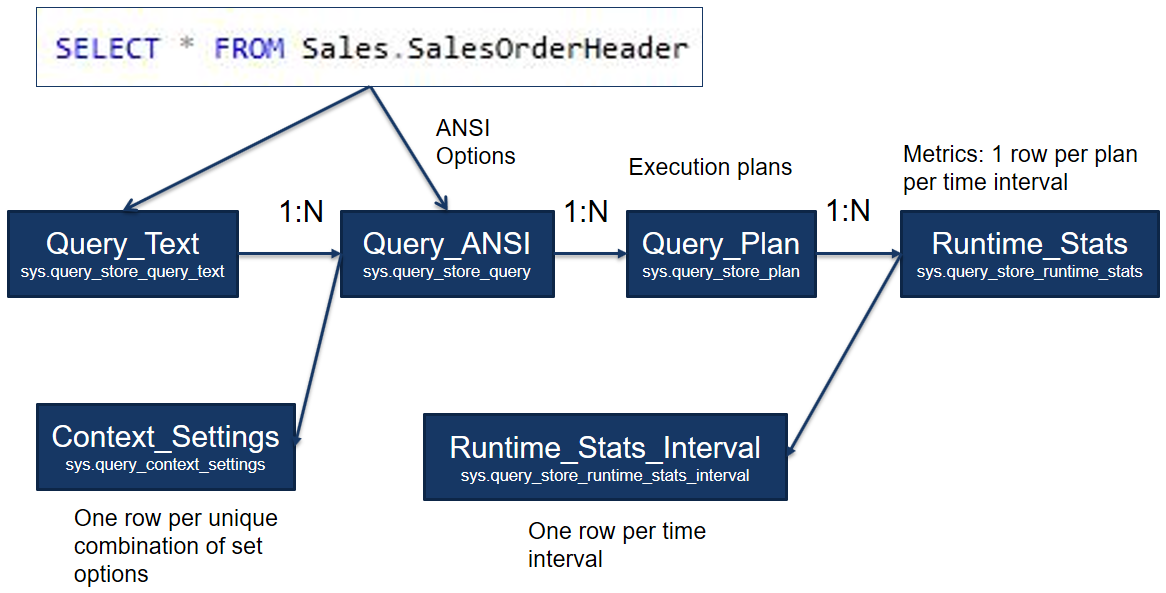
The following picture shows an overview of the most important DMVs related to the Query Store. To keep this schema easy to read, I simplified the names of the DMVs, anyway you can find the real names of each DMV in the following description.
Picture 3 – Query Store DMVs overview
Every time we run a query, the SQL Engine knows the query’s text so the Query Store can store it into the Query_Text (the real name is sys.query_store_query_text) that is the starting point of this schema. As you know, the execution plan is influenced by the ANSI Options, so for each row of the Query_Text we can have several different rows in the Query_ANSI (the real name is sys.query_store_query), one row for each unique combination of the ANSI options. For each unique combination of ANSI Options, we can have several different execution plans. All the execution plans are stored in the Query_Plan (the real name is sys.query_store_plan) all over the time; the equivalent DMV on the previous version of SQL Server is the sys.dm_exec_query_plan, but it stores only the last execution plan and you cannot know what was the previous plan for a particular query. Runtime_Stats (the real name is sys.query_store_runtime_stats) contains the execution metrics and they are memorized in this way: One row per plan per time granularity.
Suppose to have a time granularity set to 1 minute and a query that is executed three times a minute. For this scenario, in the Runtime_Stats we have one row that groups the execution metrics over that minute.
Let’s talk about the last two guys at the bottom, that one on the right is Runtime_Stats_Interval (the real name is sys.query_store_runtime_stats_interval), it is the detail of the Runtime_Stats. It stores one row per time granularity without information about the execution plan. The other one is the Context_Settings (the real name is sys.query_context_settings) that stores one row per unique combination of set options. Suppose to have a query executed by two different providers, you will have two context settings, one for each provider.
Let’s see how the Query Store works in SQL Server 2016.
Demo
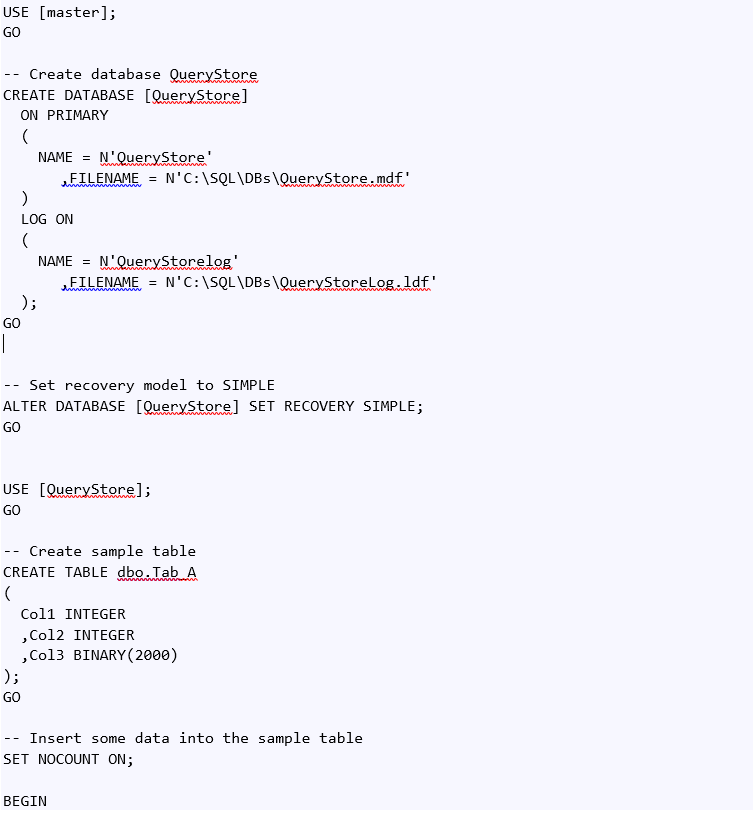
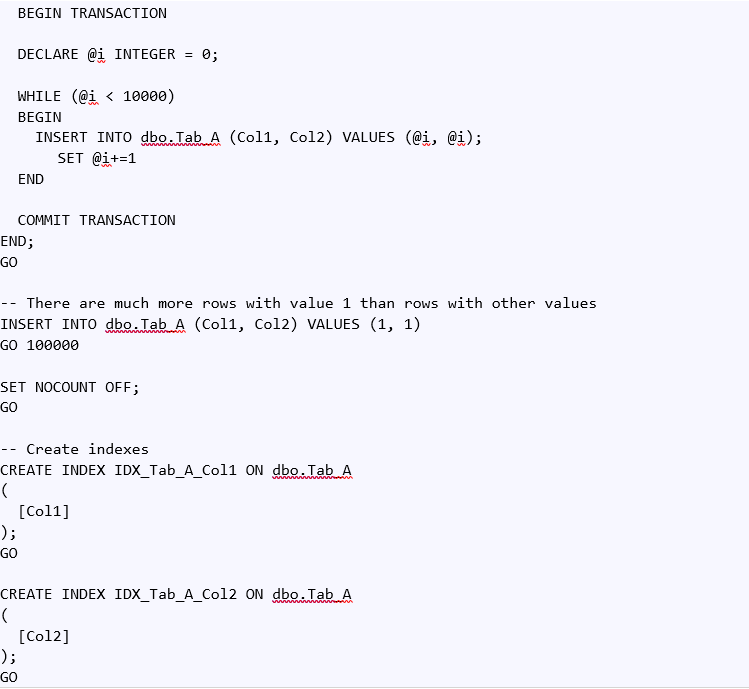
The following piece of T-SQL code contains the commands to create the “QueryStore” sample database. (You can access the code at https://docs.com/sergio-govoni/6280/10-setup-querystore-database?c=ssuSrS)
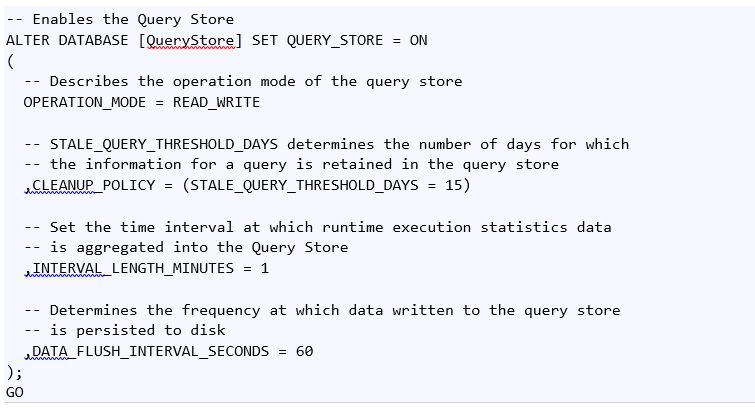
The following piece of T-SQL code enables the Query Store on the sample database. ( You can access the code at https://docs.com/sergio-govoni/4475/20-enable-query-store?c=ssuSrS)
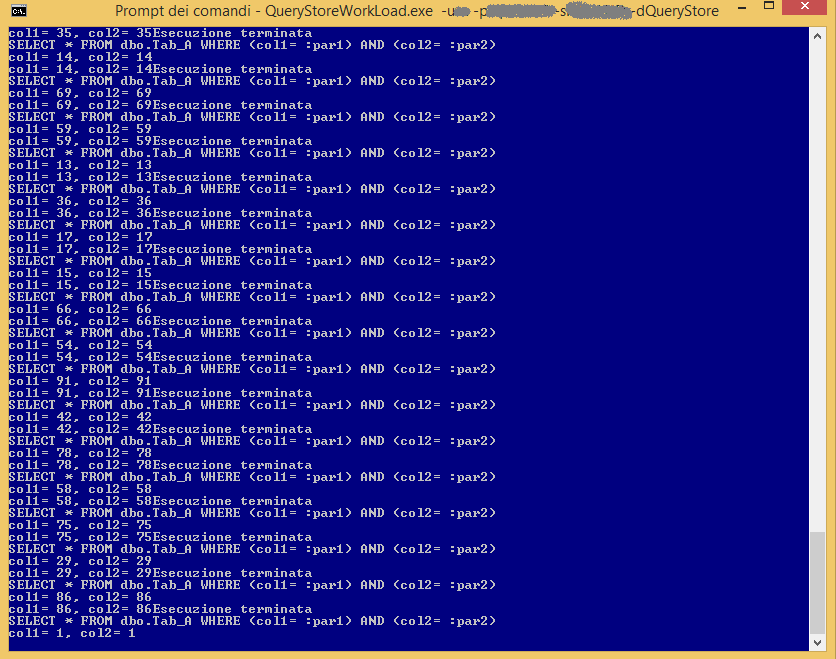
To show you how Query Store works and how a DBA can force an execution plan easily (for a particular query) I developed a sample console application that executes the following query in an infinite loop on the “QueryStore” sample database. Pay attention to the parameters because their values will be generated by a randomized function. This function returns random values between ZERO and 100. The sample application also cleans the plan cache when the parameters values are less than 2.
The following picture shows the console application at work, its goal is simulating a workload to the “QueryStore” database
Picture 4 – Generating a workload with a sample console application
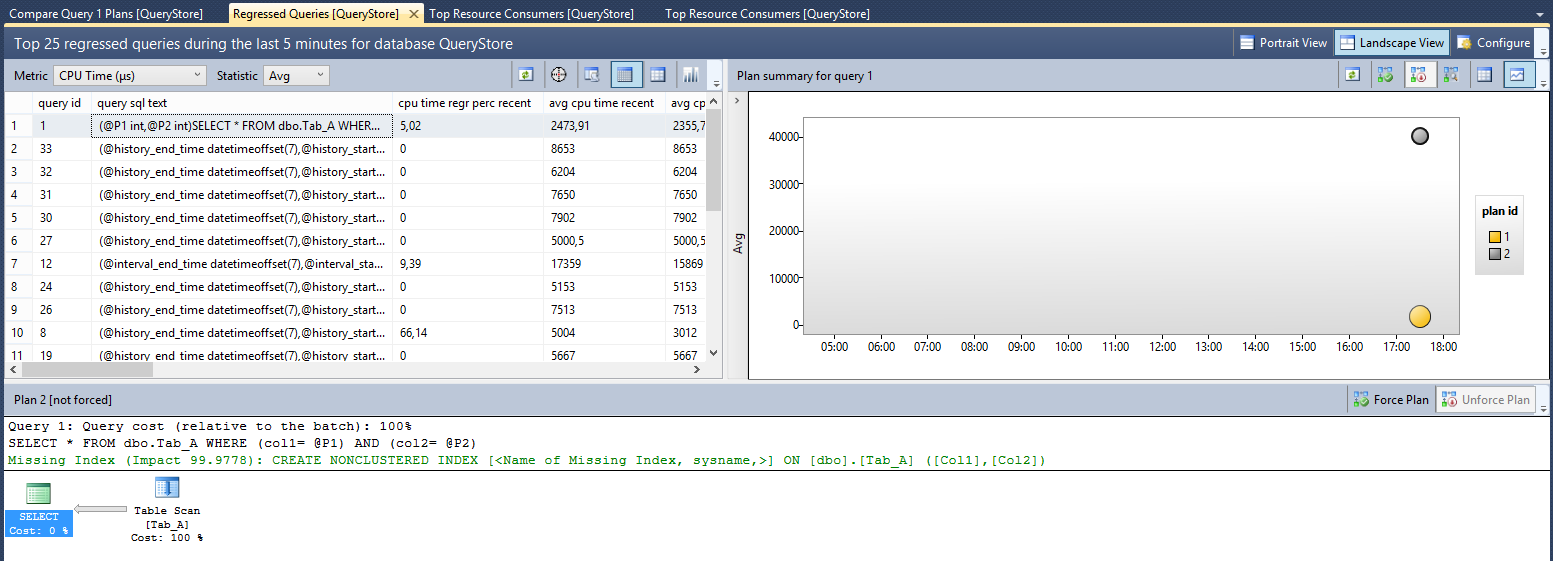
You can see which data the Query Store has captured through the SQL Server Management Studio, but also through the DMVs I have already talked about in the section “Query Store DMV Overview”. Using the SQL Server Management Studio, you can find a new branch called “Query Store” it is located under the database branch. First, you can see the “Regressed Queries” report by a double click on the “Regressed Queries” menu’ item. The following picture shows the top 25 regressed queries during the last 5 minutes for the “QueryStore” database.
Picture 5 – Top 25 regressed queries captured by the Query Store
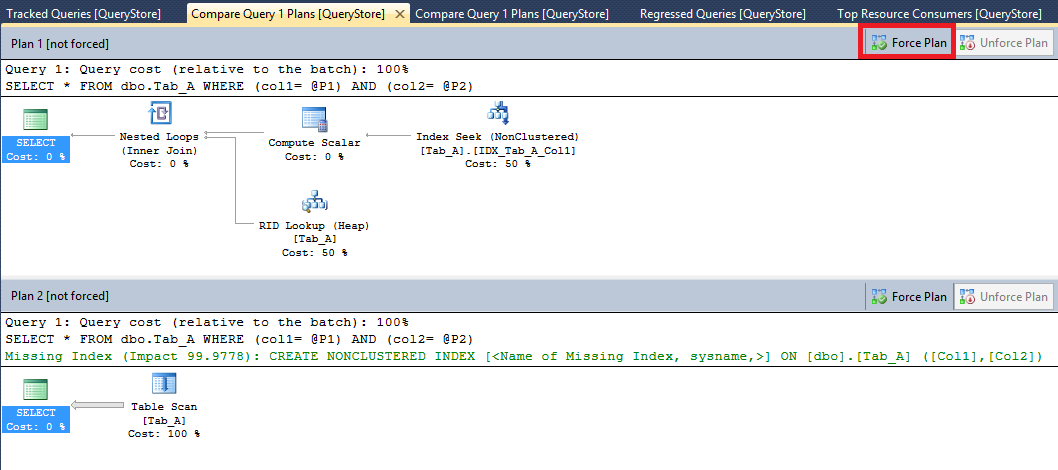
As you can see in the picture 5, SQL Server has used two execution plans for the same query, the query with query_id equal to one. These two execution plans are completely different, the ones with plan_id equal to two (“Plan 2” in the picture 5) uses a “Table Scan” operator to access the table dbo.Tab_A, on the contrary the second one with plan_id equal to one uses a most efficiently “Index Seek” to retrieve data from the same table. We have two execution plans for the same query, this means SQL Server has chosen two different ways to access data based on different values assigned to the parameters. When the value assigned to the @Parameter1 and to the @Parameter2 is equal to one, the query retrieves about 100,000 rows, on the contrary, for other values, the query retrieves less than 10 rows and the execution plan is completely different. Metrics related to each plan are stored and they are available to you by a click on the button “View Plan Summary in a grid format”, as shown in the following picture.
Picture 6 – Plan summary for the query_id 1
You can notice that the plan with plan_id equal to one is used more times compared to the plan with plan_id equal to two. These two plans have also a huge difference on the metric "average CPU usage". The plan with plan_id equal to two has a CPU usage average that is 20 times higher compared to the same metric on the execution plan with plan_id equal to one.
You can also compare the graphical representation of the two plans, you can do it using the button “Compare” on the toolbar that you can see on the right. Comparing the two execution plans you may decide to forcing one (of the two) for this particular query, the Query Store makes this task easily. In this scenario, my choice is to force the plan with plan_id equal to one for the query with query_id equal to one. I can do that through the button “Force Plan” on the toolbar that you can see on the top-right
Picture 7 – Execution Plan compare
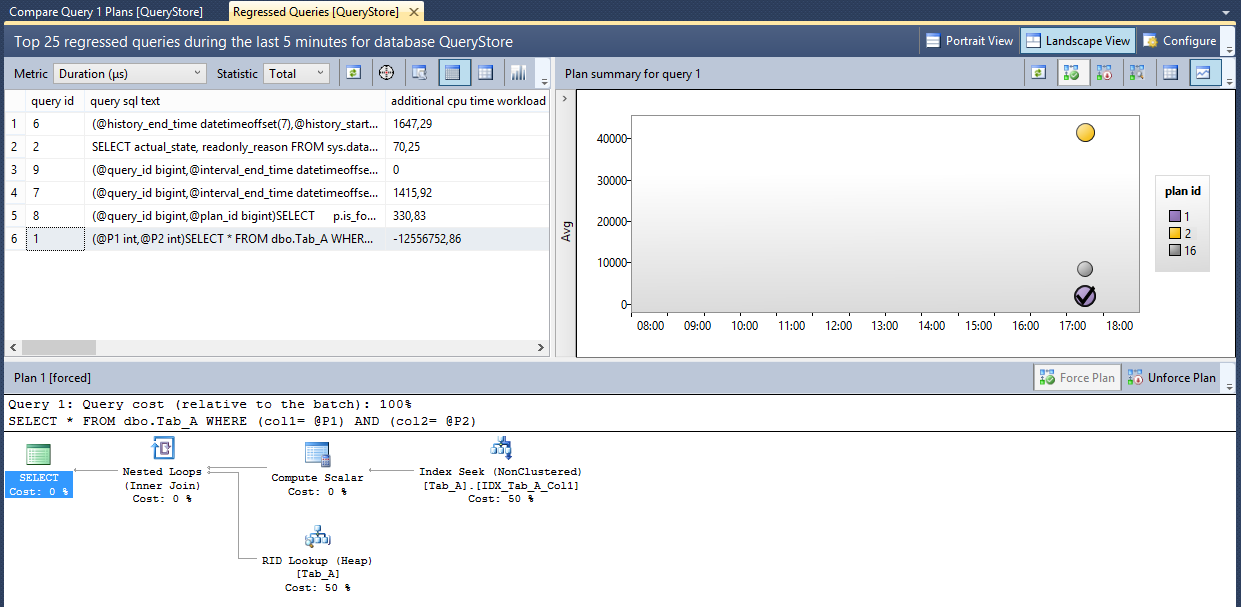
SQL Server Management Studio asks me if I’m sure to forcing the plan and if I answer yes the forcing is done! Starting from now, SQL Server Query Optimizer will use the plan that I forced instead of the other one.
Picture 8 – The plan 1 has been forced for the query 1
Query Store Tuning
Because tracking metrics like this can be expensive, SQL Server allows you to tune the Query Store. There are many factors you can adjust, they include the size of the aggregate window in minutes (INTERVAL_LENGTH_MINUTES), the max space allocated to the query store in MB (MAX_STORAGE_SIZE_MB), the maximum number of execution plans to store for each query (MAX_PLANS_PER_QUERY) and so on. You can also tell the Query Store to only record queries that meet certain criteria. SQL Server allows you to tune these options through the ALTER DATABASE statement. For more details, you can visit the page Monitoring Performance by Using the Query Store.
Additional resources
About the author
Sergio has been a software developer since 1999, and has worked for more than 16 years in a software house that produces multi-company ERP on Win32 platform. Today, at the same company, he is a program manager and software architect and he is constantly involved on several team projects, where he takes care of the architecture and the mission-critical technical details. Sergio lives in Italy and loves to travel around the world. When he is not at work deploying new software and increasing his knowledge of technologies and SQL Server, Sergio enjoys spending time with his friends and with his family. You can meet him at conferences or Microsoft events.
Comments
- Anonymous
March 30, 2016
Thank you for the explanation, but I can't help thinking that this is a very "Rube Goldberg" solution to a serious problem - the same resources could be deployed more efficiently for a better solution, with a bowling ball and five white mice left over.- Anonymous
April 01, 2016
Thanks for your feedback JRStern! Don't worry, the default configuration is the right solution for you!- Anonymous
April 02, 2016
I'm sure they are. Yet the problem remains and I wish daily for a major solution.
- Anonymous
- Anonymous
- Anonymous
October 26, 2016
Hey Sergio,Can you share the utility you used for the query store load example? - Anonymous
November 16, 2016
Hello, Sergio. thank you for the article. I was wondering if you have any information on how Query Store can be used to justify the upgrade to the next version of SQL Server. For example 2012 to 2016. Is there a way to capture a trace on production, then move backup to a 2016 server, change the compatibility to 2016, enable query store and replay the trace. And also have another copy in 2012 compatibility mode with enabled query store to replay same trace and then compare 2 query stores? I cannot find any detail on how this can be accomplished . Thank you in advance
