New metric measurement alert rule type in Public Preview!
Hi folks, Anurag here. Today I want to talk about a new powerful alerting capability for Operations Management Suite (OMS): metric measurement alerts.
Traditionally, OMS alerts have only used the number of results returned from Log Search to provide alerting capabilities. With metric measurement alerts, we now allow broad alert rule definitions across a group of objects with the ability to evaluate a threshold and raise alerts on single objects. This new capability also comes with more granular trigger conditions such as single or consecutive breaches.
To provide more context about this new feature, the following table showcases applicability of alert types.
Examples of alerts
| Type of alert | Scenario |
|---|---|
| Number of results | Send Alert if Computer A’s CPU is ever above 90% |
| Number of results | Send Alert if Computer A’s average CPU is ever above 90% |
| Metric measurement | Send Alert if Computer A’s average CPU goes above 90% twice over 2 hours |
| Metric measurement | Send Alert if Computer A’s average CPU goes above 90% twice in a row over 2 hours |
| Number of results | Send Alert if Computer Group A’s average CPU is ever collectively above 90% |
| Metric measurement | Send Alert PER Computer if any Computer in Computer Groups A’s average CPU is above 90% |
| Metric measurement | Send Alert PER Computer if any Computer in Computer Group A’s average CPU is above 90% 3 times over 2 hours |
| Metric measurement | Send Alert PER Computer if any Computer in Computer Group A’s average CPU is above 90% 2 times in a row over 2 hours |
Create a metric measurement alert
You create a metric measurement through the same workflow as traditional number of results alerts. Additionally, any of the on-demand aggregation queries used for performance metrics work. See the On-demand metric aggregation and visualization in OMS blog post for information about how to craft these on demand aggregation queries.
Requirements
The main difference when you define metric measurement alerts are the following two requirements:
- “measure” statement – Metric measurement alerts require a grouping on a field to indicate what object to alert on.
Ex: Type=Event | measure count() by Computer interval 5 minute
Ex: Type=Perf ObjectName=Processor CounterName= | measure avg(CounterValue) by Computer interval 2minute
- interval” statement - This specifies your sampling interval for your metric for how your data is aggregated.
Ex: Type=Perf ObjectName=Process CounterName=”% Processor Time”| measure avg(CounterValue) by InstanceName interval 3minute
Ex: Type=W3CIISLog | measure avg(TimeTaken) by Computer interval 30minute
Additional steps
- Switch Alert Type toggle from Number of Results to Metric Measurement.

- Switch Alert Type toggle from Number of Results to Metric Measurement.
The threshold is based off the metric aggregation from the query. For example, if you are using Memory as the metric and want to alert if Memory is less than 1 GB, set the threshold to Less Than and the value to 1000.
Pro-Tip: Open two tabs, one with Log Search and the metric chart and the other as the Alert Creation page. In the future, we plan to integrate visualizations straight into the alert creation process.
- Choose Trigger conditions.
Metric measurements come with the ability to define trigger options at a granular level. These two options are Total Breaches or Consecutive Breaches.
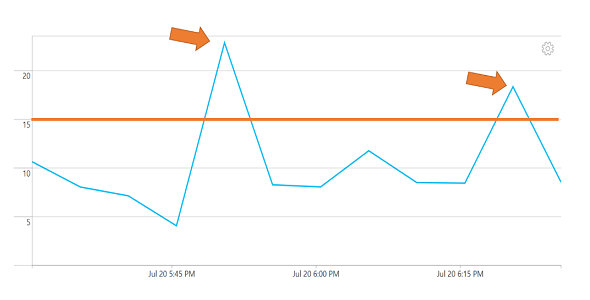
Total Breaches: When X out of Y samples exceed the threshold fire alert. For Example, if a sampling interval is defined as 15 minutes and a 60-minute time window is defined, there are 60/15 or 4 samples to choose from. If we set the trigger condition to greater than 2 total breaches, an alert fires if 3 out of the 4 samples are greater than the threshold set.
On the following chart, if threshold is set to 15 and trigger condition is set to Greater than 1 total breach, my alerts fire as there are two violating points in the specified time window.

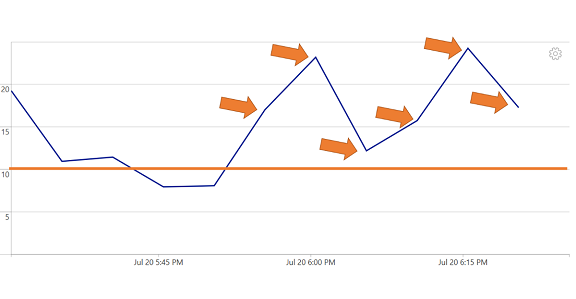
Consecutive Breaches: If X consecutive samples exceed the AggregateValue threshold. The time window is less important in this case. For example, if my trigger condition is greater than 2 consecutive breaches, I will raise an alert if the last 3 samples are greater than the threshold of AggregateValue.
In the following graph, if I set my threshold to 10 and my trigger condition to greater than 5 consecutive breaches, the alert would fire for the given time window because there are 6 consecutive violations.

Metric measurement alerts in search
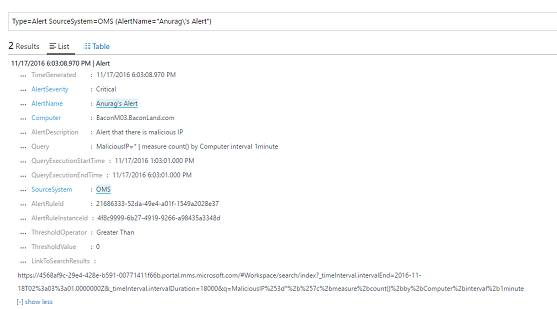
As metric measurement alerts are evaluated for each unique object that is part of the grouping, we get unique alerts for each object. This also means actions such as email/runbook/ Webhook are initiated per alert firing.
Additionally, you can group by the specific computer field. This field is then available in the alert record in search.

Example queries for alerts
| Alert rule description | Query |
|---|---|
| Alert if any computer talks to a malicious IP X times | MaliciousIP=* | measure count() by Computer interval 1minute |
| Alert if any Windows or Linux CPU % is greater than X | Type:Perf ObjectName=Processor CounterName="% Processor Time" | measure avg(CounterValue) by Computer, InstanceName interval 5minutes |
| Alert if any Windows or Linux Memory Used % is greater than X | Type:Perf ObjectName=Memory (CounterName="% Used Memory") | measure avg(CounterName) by Computer interval 5minutes |
| Alert if any Windows or Linux agent has missing Security Updates | Type:Update AND Classification="Security Updates" UpdateState=Needed Optional=false | measure count() by Computer interval 12hours |
Comments
- Anonymous
November 26, 2016
Thank you for new alert type "Metric Measurement".I can create more alert by metrics.and I hope to be Japanese text of "Metric Measurement" to "集計値" instead of "メートル法の測定単位".because "メートル法の測定単位" means "unit of measure by the meter metric system", which do NOT mean "Metric Measurement".Regards,