Configure Microsoft OMS to monitor Exchange Server
Summary: Learn how to configure Microsoft Operations Management Suite to monitor Exchange Server.
Good morning everyone, Ed Wilson here. It seems that if one hangs around in the IT field long enough, one will begin to see things that recur. It is kind of like the Fairchild oak tree that Teresa and I recently saw in the Bulow Creek State Park. This tree is more than 400 years old, and it has obviously seen a lot. If you love nature and the environment, this park is a great place to sit and contemplate—to imagine the history that this tree has witnessed and to wonder what life was like when this wonderful tree was a small sapling. (Not like Lucy said, “This is an elm tree. One day it will grow up to be a mighty oak.”)
Anyway, things keep coming around because they are important. Another reason we see things coming around again in the IT world is because they are fundamental. As new techniques and tools appear, we learn how to use them to perform the same sorts of tasks because the old tools either disappear or we simply would like to consolidate several tools into a single solution. This is quite often a good thing.
Check log collection and perf data
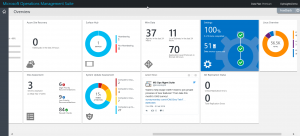
The first thing that I need to do if I want to monitor Exchange Server is ensure that Microsoft Operations Management Suite is collecting the appropriate logs and near real-time performance data. To do this, I access the Settings on my MS OMS Overview screen:
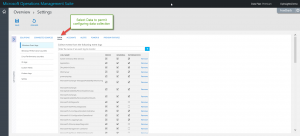
On my Overview > Settings screen, there are multiple tabs, including Solutions, Connected Sources, and Data. I want to select the Data tab because it will permit me to configure the data that OMS collects.
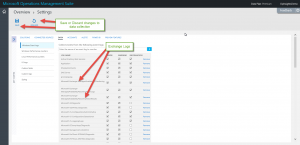
In the left pane, the first category is Windows Event Logs. I can scroll down this list and see what Exchange logs are actually collected. Of course, as we all know, there are dozens of logs created by Exchange—some of which are only enabled during troubleshooting scenarios. So this list can be rather long. Here are some of my Exchange logs that are being collected. Note that when I add a log, I can configure OMS to collect Error, Warning, or Information events. When I no longer want or need to collect a specific log, I click Remove.
Note I will get a validation error if I attempt to deselect Error, Warning, and Information events. So I cannot have a log that is present as a data source, but not currently being collected. I must remove the log and then add it back later if I need it.
To add a new Exchange log to my data collection, I do not need to type the entire name. I only need to type enough so that MS OMS can find it. As I type and pause for a second, OMS will prompt me with suggestions. This is shown here where I typed Exchange in the Collect Events from the following event logs text box:
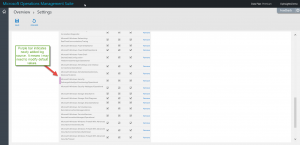
If the log I want appears in the popup suggestion box, I merely select it from the list and click the blue add button ( + ). This will add it to my list of data sources. I can then modify which log events I want (Error, Warning, or Information). By default, all three types of events are added. When I get a decent collection of event logs, the list can become pretty long. So as shown here, OMS highlights the newly added log with a purple bar:
Note Remember that changes are not in effect until I either Save or Discard them.
Exchange Server searches
Obviously, I am going to be doing an Event type of search. So I begin with the following query:
Type=Event
But then I may want to specify a source for my event logs. Often sources are associated with only one event log, but that may not always be the case. Here I do a search for the Microsoft-Exchange-ManagedAvailability source:
Type=Event Source=Microsoft-Exchange-ManagedAvailability
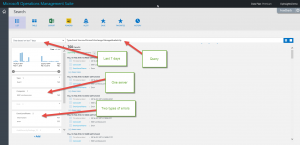
As shown in the following image, I have 760 results. I can also see that there are two event levels: Information and Error in the last 7 days. I can also see that I have log data from only one Exchange Server (Ex01.contoso.com).
That is all I have for you today. Join me tomorrow when I’ll talk more about examining Exchange Server monitoring data in OMS.
I invite you to follow me on Twitter and the Microsoft OMS Facebook site. If you want to learn more about Windows PowerShell, visit the Hey, Scripting Guy! Blog. If you have any questions, send email to me at scripter@microsoft.com. I wish you a wonderful day, and I’ll see you tomorrow.
Ed Wilson
Microsoft Operations Management Team
Comments
- Anonymous
June 16, 2016
The comment has been removed- Anonymous
July 03, 2016
I can not find any "Exchange" in my 'Collect the following performance counters', no suggested counters appear also. Please advise how I can monitor my exchange with OMS
- Anonymous

