Bring your custom collectd metrics into the OMS Log Analytics platform
Summary: Learn how to set up and install the collectd Linux open source daemon so that you can bring performance metrics into OMS Log Analytics.
Good morning everyone, Anurag Gupta here, and today I’m going to show you how to bring your custom collectd metrics into the powerful Log Analytics platform. collectd is an open source Linux daemon that periodically collects performance and statistical information from a variety of sources, which are listed in the collectd plugins library. collectd is generally used in tandem with metric graphing systems such as Graphite and Grafana.
When you bring collectd metrics into OMS, you can use all the metrics capabilities in the Log Analytics (OMS) platform and the ability to correlate with other infrastructure and application data. Additionally, because the Log Analytics (OMS) platform already handles petabytes of indexed data today, you don’t need to worry about your metrics backend failing you in your critical time of need.
Requirements
A Linux server with one of the following supported Linux operating systems
Set up collectd
To get started, we first install collectd on our Linux server.
Note: If you already have collectd installed, you can skip to the next section.
- For Ubuntu and Debian, collectd is included in the default repos and you can install it by running the following command:
sudo apt-get install –y collectd
- After you install collectd, configure the sources from which you want to pull data. For the purposes of this post, I am going to set up metric retrieval from MySQL Server.
To set up collection of metrics from MySQL, I’ll uncomment the LoadPlugin MySQL line and the mysql plugin section in /etc/collectd/collectd.conf. Additionally, in the mysql plugin section, I’ll specify the database from which I want to collect metrics.
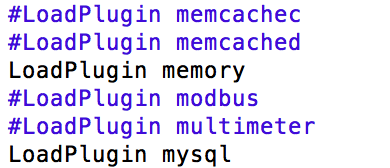
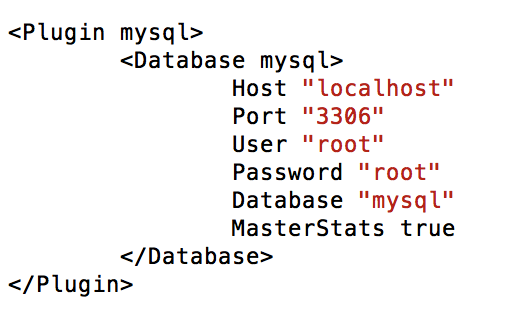
- After these two data sources are configured, I can restart the collectd daemon to commit the settings and watch the collectd logs to confirm that all the loaded credentials are working correctly.
collectd Daemon restart
sudo service collectd restart
Check collectd log
tail /var/log/collectd.log
Set up OMS Agent for Linux
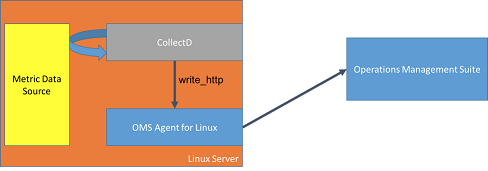
After collectd is set up to collect metrics from my application, I’ll set up collectd to send these metrics to an OMS Agent for Linux to route them to Log Analytics (OMS). collectd sends metrics over a local http port to fluentd by using the native write_http plugin. The following diagram gives a brief architectural overview.
- Download the OMS Agent for Linux v1.1.0-217 or later
- Install and onboard the OMS Agent for Linux v1.1.0-217 by using the --collectd option during installation.
./omsagent-1.1.0-217.universalx64.sh --upgrade -w <OMS WORKSPACE ID> -s <OMS WORKSPACE KEY> --collectd
Note: If OMS Agent for Linux is already installed, you can also run the following command to set up collectd to forward metrics to OMS Agent for Linux:
sudo /opt/microsoft/omsagent/bin/omsadmin.sh –c
- Restart collectd and the OMS Agent for Linux again.
sudo service collectd restart
sudo service omsagent restart
View collectd metrics in Log Analytics (OMS)
To have a common model between infrastructure metrics that are already collected by the OMS Agent for Linux and the additional metrics that collectd gathers, the following schema mapping is used:
| collectd metric field | OMS field mapped | ||
|---|---|---|---|
| host | Computer | ||
| plugin | none | ||
| plugin_instance |
|
||
| type | ObjectName | ||
| type_instance |
|
||
| dsnames[] | CounterName from type_instance + [dsnames] | ||
| dstypes | none | ||
| values[] | Value |
View all collectd metrics for MySQL
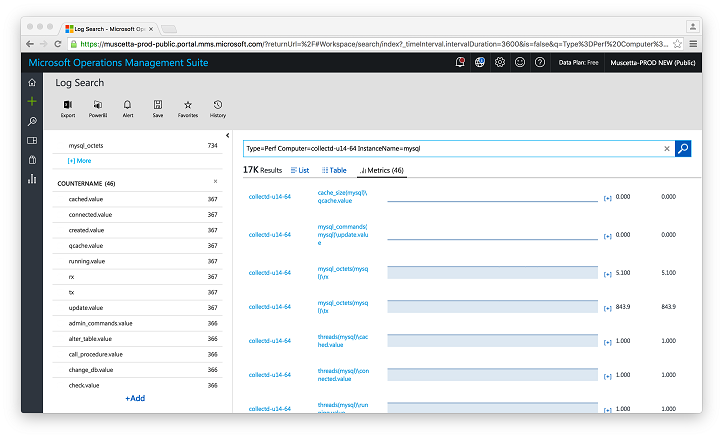
collectd MySQL metrics are under the plugin_instance of MySQL, which maps to the InstanceName in OMS Log Analytics. From here, I can dive into specific objects that are relate to MySQL and associated counters.
Additional use cases
After I have this powerful metric data inside Log Analytics (OMS), I can begin to design views for my applications by using View Designer. I can grant my application admins quick insights over performance and application log data in a single pane. For example, here is a quick view generated for MySQL.
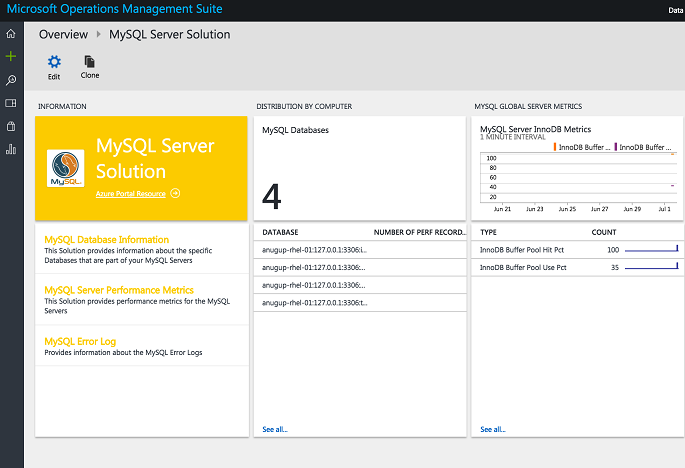
For a full tutorial about how to use View Designer, watch this video or read the OMS View Designer: Visualize your data your way blog post.
Summary
Now you can bring a variety of rich metrics from collectd into the powerful Log Analytics platform and correlate issues with your other infrastructure/application data. We look forward to your feedback and to see what awesome views you design. If you have questions, feel free to reach me on twitter @Agup007 or email me at anugup@microsoft.com.
We invite you to join the Microsoft OMS Facebook site. If you want to learn more about Windows PowerShell, visit the Hey, Scripting Guy Blog.
Get a free Microsoft Operations Management Suite (#MSOMS) subscription so that you can test it out. You can also get a free subscription for Microsoft Azure.
Anurag Gupta
Program Manager
Microsoft Operations Management Team
Comments
- Anonymous
December 07, 2016
Nice Articles Mr Gupta , I Would Like To know , How I get the Metrics From Cisco Router , Actually I have Lunched Router from AWS.I have allowed ICMP and Snmp also configured snmp-server on Router to trap the Info to my Graphite server through the Collectd deomn. But I am not ale to see the Matrices, Please suggest me .. Thanks,Chandan. - Anonymous
February 14, 2017
Hi,Additional information on how to setup OMS with CollectD :https://github.com/Microsoft/OMS-Agent-for-Linux/blob/master/docs/OMS-Agent-for-Linux.md#collectd-metricsHope it will be helpful.