PRF0025: No data was collected – why is that?
One day, you may try to use Visual Studio profiler to sample an application you develop, and end up with an error saying no data is collected:
Profiling started.
Profiling process ID 2752 (<Your Application Name>).
Process ID 2752 has exited.
Data written to C:\<some path>\Report100114.vsp.
Profiling finished.
PRF0025: No data was collected.
Profiling complete.
There could be number of reasons for that.
The first question I will ask: “Is your application CPU bound?”. If your process doesn’t use CPU intensively enough during the profiling session (it waits on IO instead, for example), than the process becomes “invisible” for default profiler sampling (as events that trigger a sample happen when other applications are running – see my previous post explaining different samples and what they mean). If you use advanced sampling, configuring some specific CPU Performance Counter (through either /COUNTER command line option, or using Visual Studio UI) – for example, L2 Cache Misses – then again, if your application doesn’t generate samples of that specific event, no data will be collected. In those cases you may try to switch to Instrumentation mode.
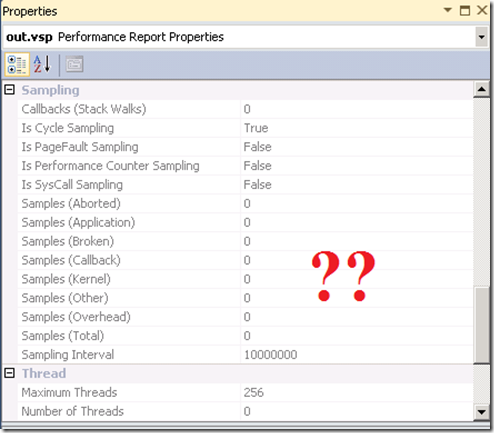
If, however, you are sure your application is CPU bound as you see CPU spikes during its execution, yet Visual Studio claims “no data was collected” – please look into Properties of the collected file (you can get it by pressing F4). In some rare cases you will see all collected Samples are set to 0. Which means no sample was collected at all (normally, even if your application is not CPU bound – samples are collected, but they belong either to kernel mode, or other applications; Total number of samples equal to 0 is something really strange). The question I will ask in this case is: “Did you use any other diagnostic tool recently? Especially those, that are not developed by Microsoft?” And if you answer “Yes”, please reboot your machine and try again. The reason is that some tools may leave your machine hardware in a state that breaks functionality of Visual Studio profiler. Reboot will fix it for you.
