DFSR Debug Analysis with Message Analyzer – Part 1, Introduction
A little while ago I decided to spend some time learning Message Analyzer and to form an understanding of where it would fit in to my troubleshooting workflow. I started out reading the Message Analyzer blog posts which are a great source of material. Depending on the version of Message Analyzer you start out with, the posts can be a little tricky to follow as the UI has changed over the past few releases. I found this beneficial in the end – it forced me to understand what I was looking at instead of just copying a walk through.
After gaining some comfort with Message Analyzer, I started to think about troubleshooting scenarios I could apply it to. I wondered whether I could go back to an old scenario that I’d previously blogged on AskDS and gain the same insights.
To fully understand the scenario, I suggest you read this old post. I’ll summarise here –
- Constant change of DFSR replicated content was observed by a customer
- Change was observed to occur at different rates during different times of the day
- I wanted to be able to chart the rate of content change to understand patterns before investigating further
In order to achieve my objectives, I was going to need –
- A Message Analyzer parser for DFSR Debug logs
- Message Analyzer charts that could show me different views of the data
Learning to Write a Parser
My review of the Message Analyzer blog posts pointed me to the OPN Configuration Guide to Text Log Adapter. This is a good starting point for writing a Message Analyzer Parser. It includes a sample log and sample parser definition.
The other great reference is the built-in Message Analyzer parsers themselves. These reside in –
%localappdata%\Microsoft\MessageAnalyzer\OpnAndConfiguration\TextLogConfiguration\DevicesAndLogs\
The Result
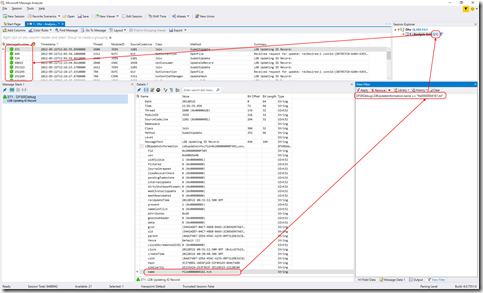
Using a combination of the resources mentioned above, I was able to construct a DFSR Debug Log parser for Message Analyzer –
DFSR Debug Log messages parsed into fields and values –
Filtering applied allows investigation of specific DFSR Debug Log messages –
Charts that show DFSR Messages over Time –
My following posts will walk through the construction of this parser, Analysis Grid view and charts
Next Up


