Visual Studio 2012 and Parallel Watch Window
Traditionally, debuggers have been very per thread centric. For example, a debugger most typically will assign a thread to be the current thread and any thread related debug operations you perform will be done on the selected thread. In order to work with a different thread, you need to first switch the thread context. One of the ways that you were able to switch the active thread in Visual Studio was to bring up the Threads Window and double click on the thread of interest. While this works fine for applications with relatively few threads, it becomes cumbersome for heavily multithreaded applications. Luckily, Visual Studio 2012 RC has a feature known as Parallel Watch Window that aids greatly in these scenarios.
At a high level, a watch window allows you to watch the results of expressions. The expressions can be as simple as the value of a local variable but can also be much more complicated. Imagine we have the following simple code that multiple threads execute concurrently:
private static void WorkThreadFunction()
{
for (int i = 0; i < max_list_len; i++)
{
// Do work
}
}
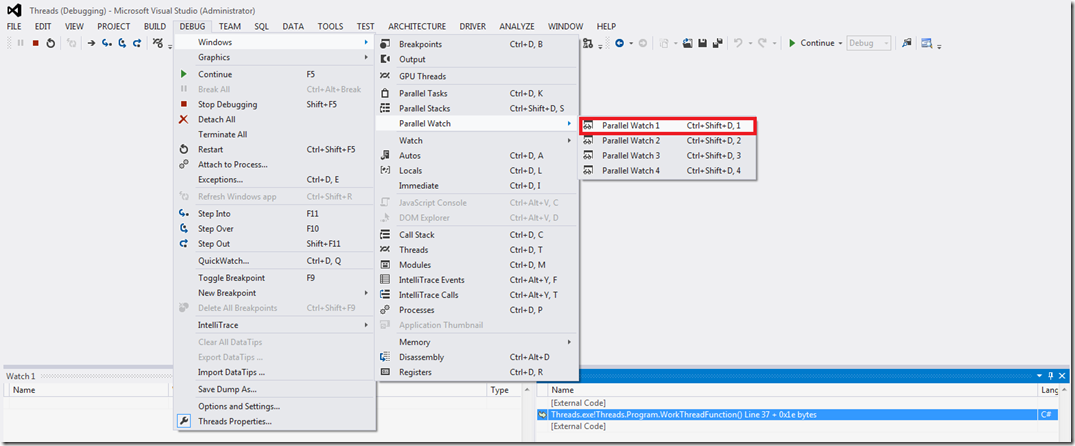
Nothing too fancy – simply multiple threads iterating through a list of some sort. Now, lets say that 25 threads were currently executing the function above and we want to see at which iteration (‘i’) each of the threads is currently executing. Previously we would have to switch the active thread context 25 times and record the value of ‘i’ somewhere. Instead, with Visual Studio 2012 RC we can bring up the Parallel Watch Window as shown below:
Choosing Parallel Watch Window 1 (there are four to choose from) displays the Watch Window:
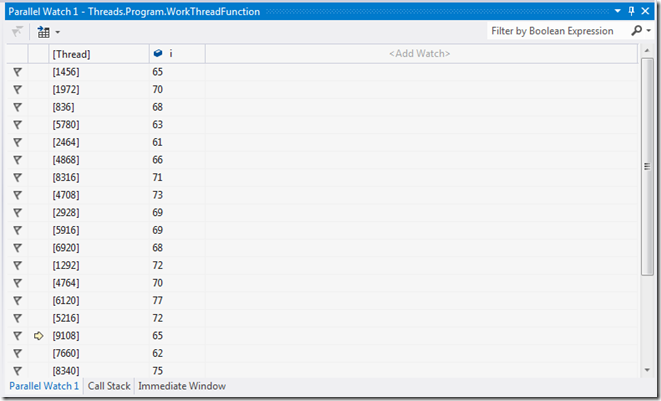
By default, the Parallel Watch Window brings up all the thread currently executing in the process. In order to add new watches, we need to click “<Add Watch>” column which allows us to enter an expression. In our case, the expression is as simple as showing the local variable ‘i’:
As soon as the watch is added we can now see the expression evaluated across all the different threads in the watch window:
Another interesting aspect of the Parallel Watch Window is that you can sort the columns as well as adding a filter to the watch (Filter by Boolean Expression).
This is a pretty powerful and time saving feature if you spend lots of time doing multithreaded debugging.
Until next time, happy debugging!
Comments
Anonymous
June 11, 2012
Great article. Thanks for sharingAnonymous
June 11, 2012
Superb feature...Anonymous
March 05, 2015
I have Visual Studio 2012. The "Watch1" window is inactive in debug mode, so that neither I can write the object name there to see its value at the moment nor it let me drag and drop it to the "Name" of the window. I think, it'd be better for me to forget this Microsoft Product.


