Hinweis
Für den Zugriff auf diese Seite ist eine Autorisierung erforderlich. Sie können versuchen, sich anzumelden oder das Verzeichnis zu wechseln.
Für den Zugriff auf diese Seite ist eine Autorisierung erforderlich. Sie können versuchen, das Verzeichnis zu wechseln.
In this example I´ll be creating an ARM template with a couple of Azure Log Analytics tiles.
I wanted to create a Dashboard with some performance metrics that could be reused in different environments.
So, create a new dashboard, pin the intended tiles, "export" to an ARM template and reuse, right ? Well, the export part is a bit tricky.
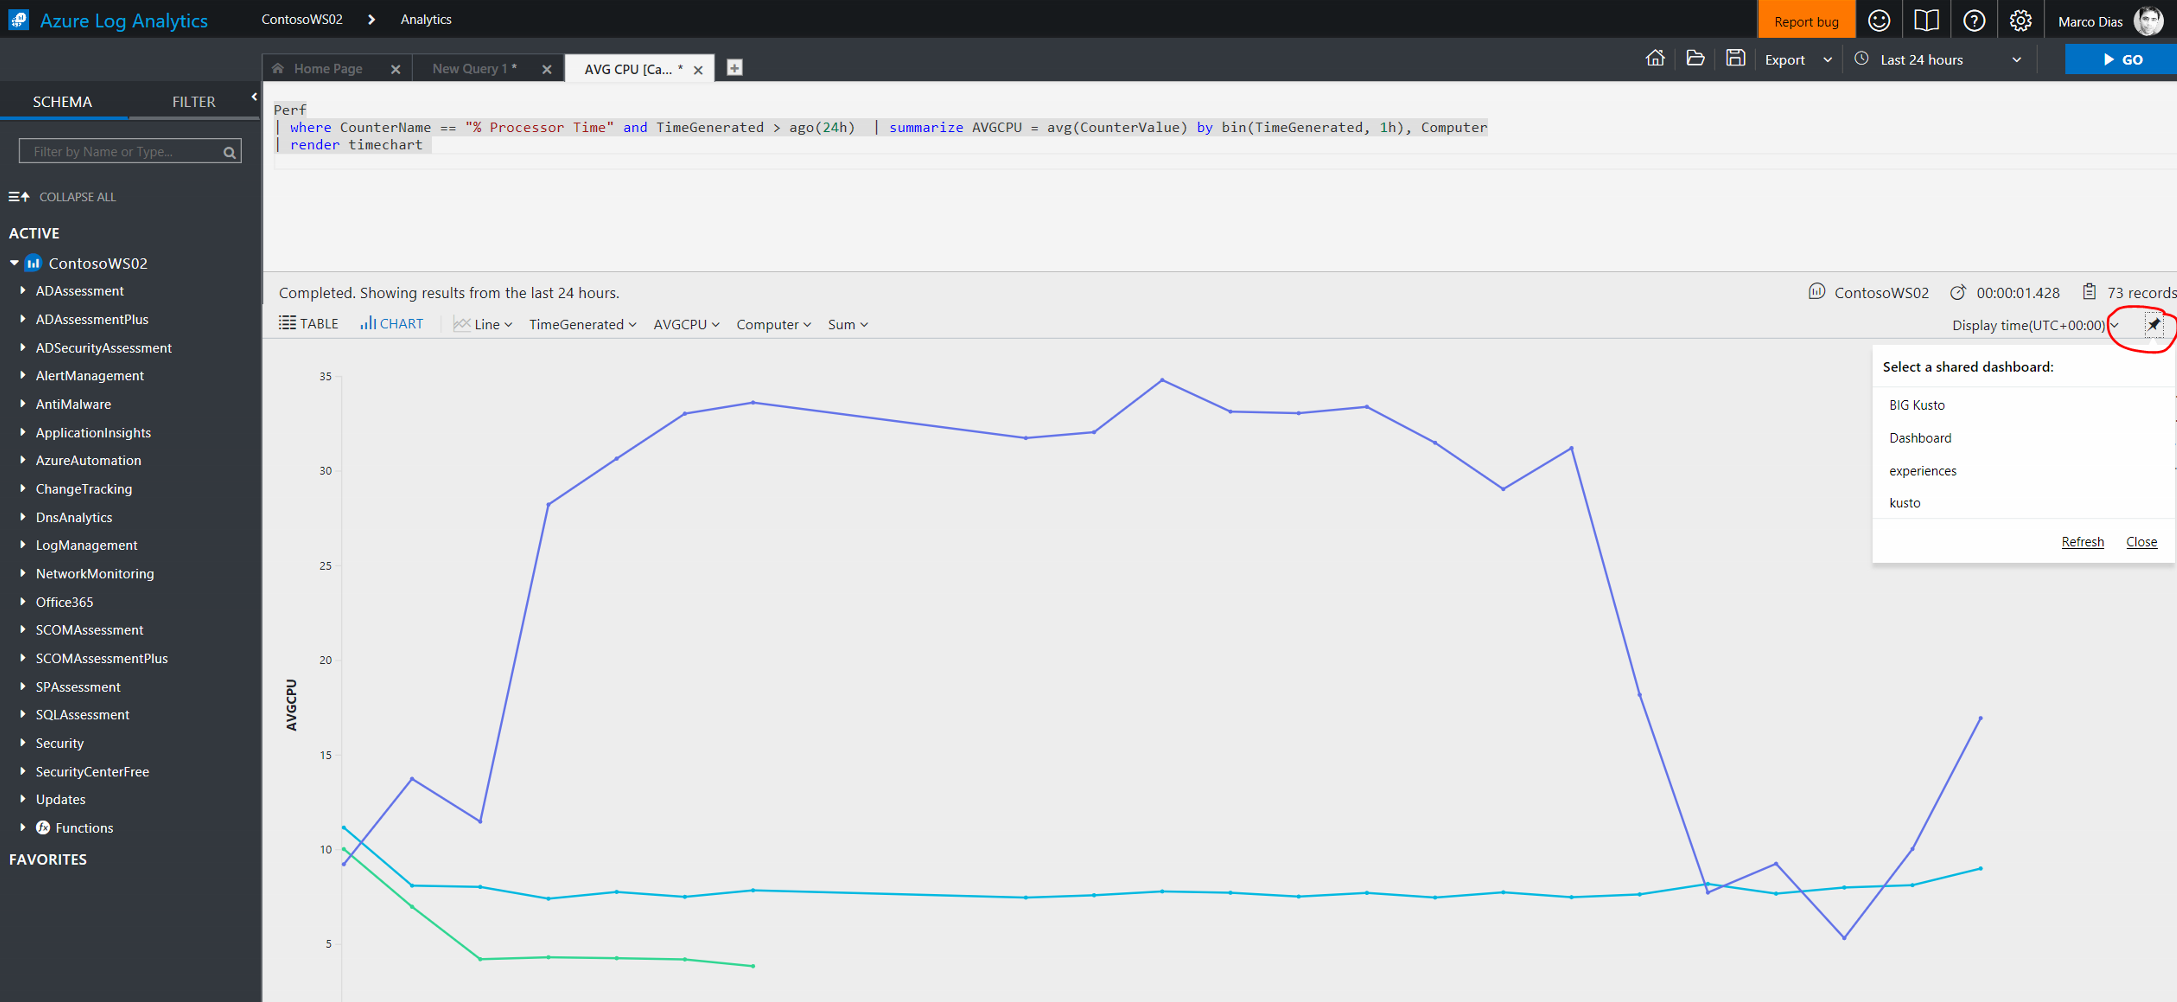
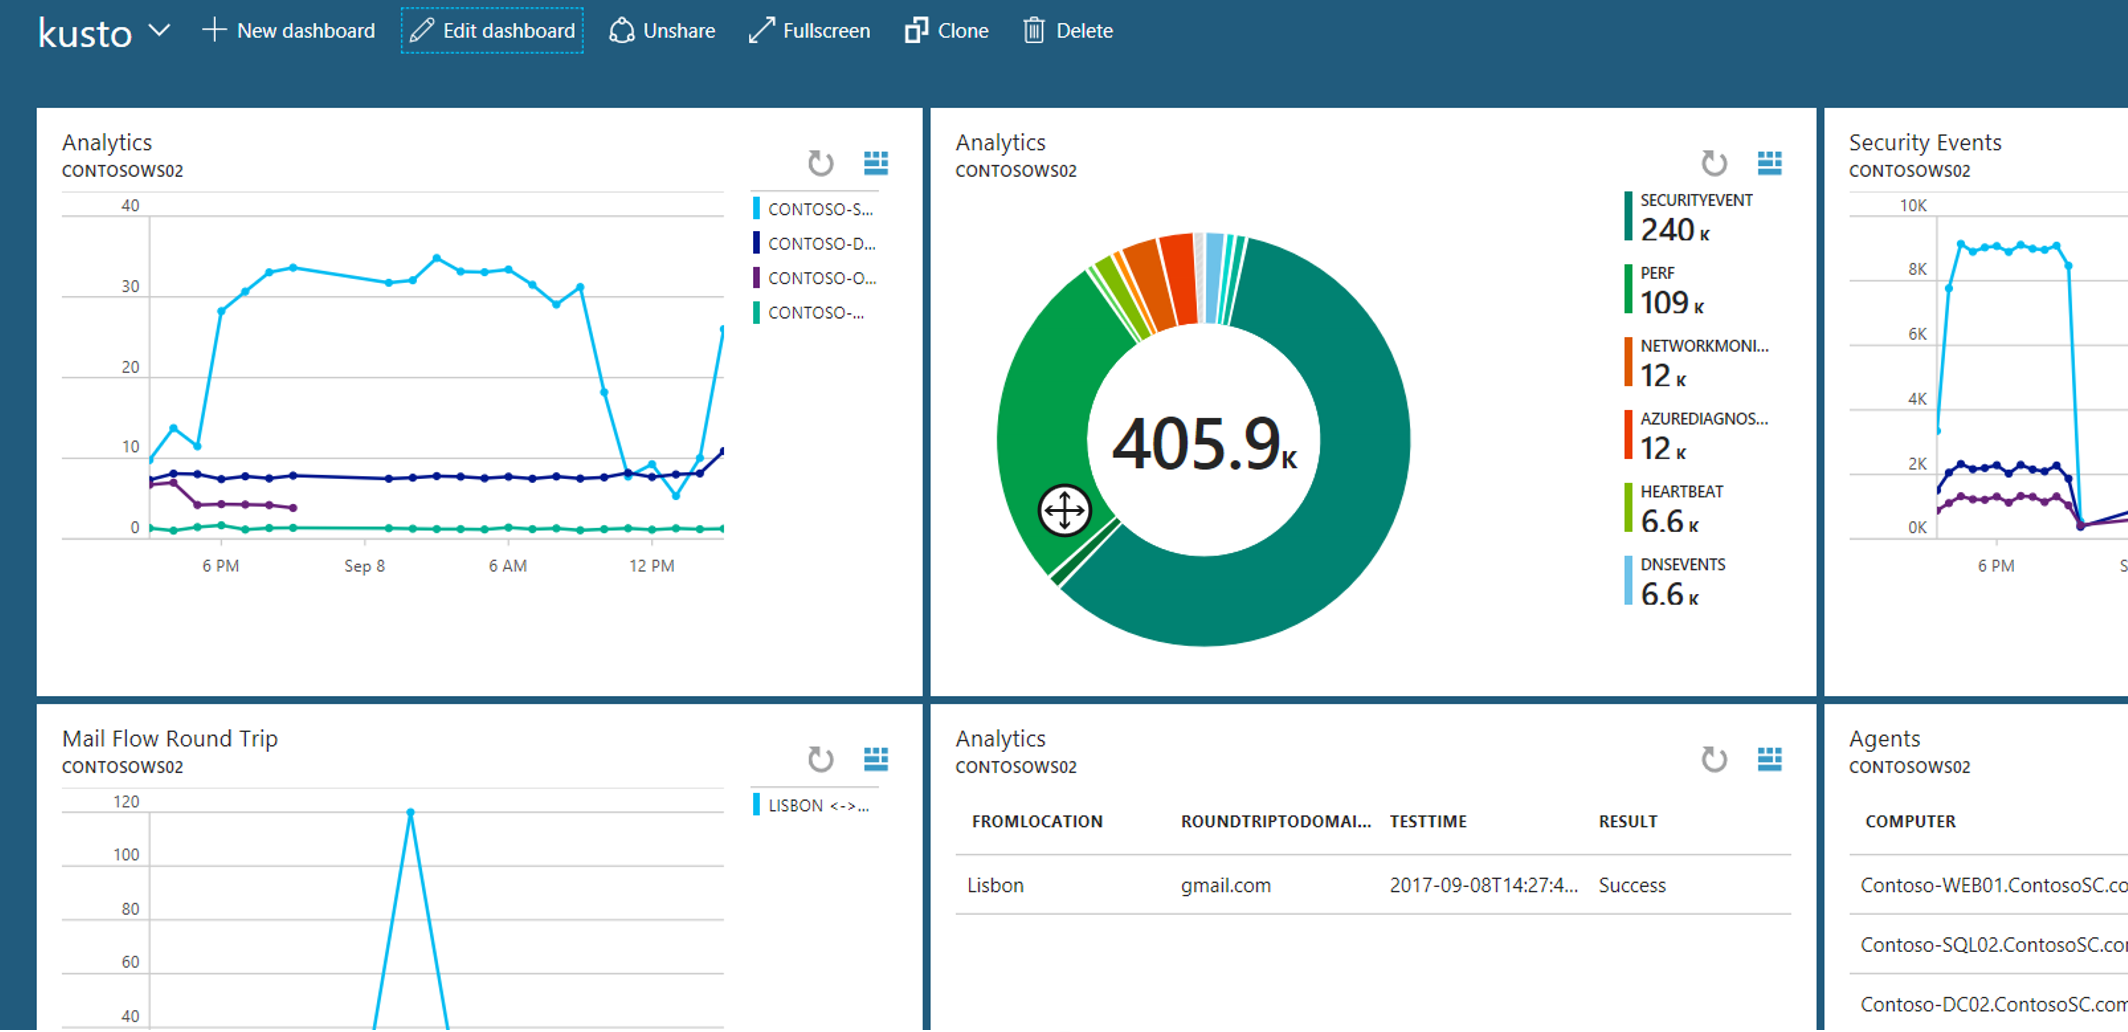
First, open up the new Log Analytics query editor and pin the tiles to a new dashboard ( that should already exists as a saved dashboard in a resource group ) .
In this example I´m querying the Average CPU usage for all my agents in the last 24 hours to render as a time chart:
Perf
| where CounterName == "% Processor Time" and TimeGenerated > ago(24h) | summarize AVGCPU = avg(CounterValue) by bin(TimeGenerated, 1h), Computer
| render timechart 

Then, when you´re happy with the looks, the fun part begins…
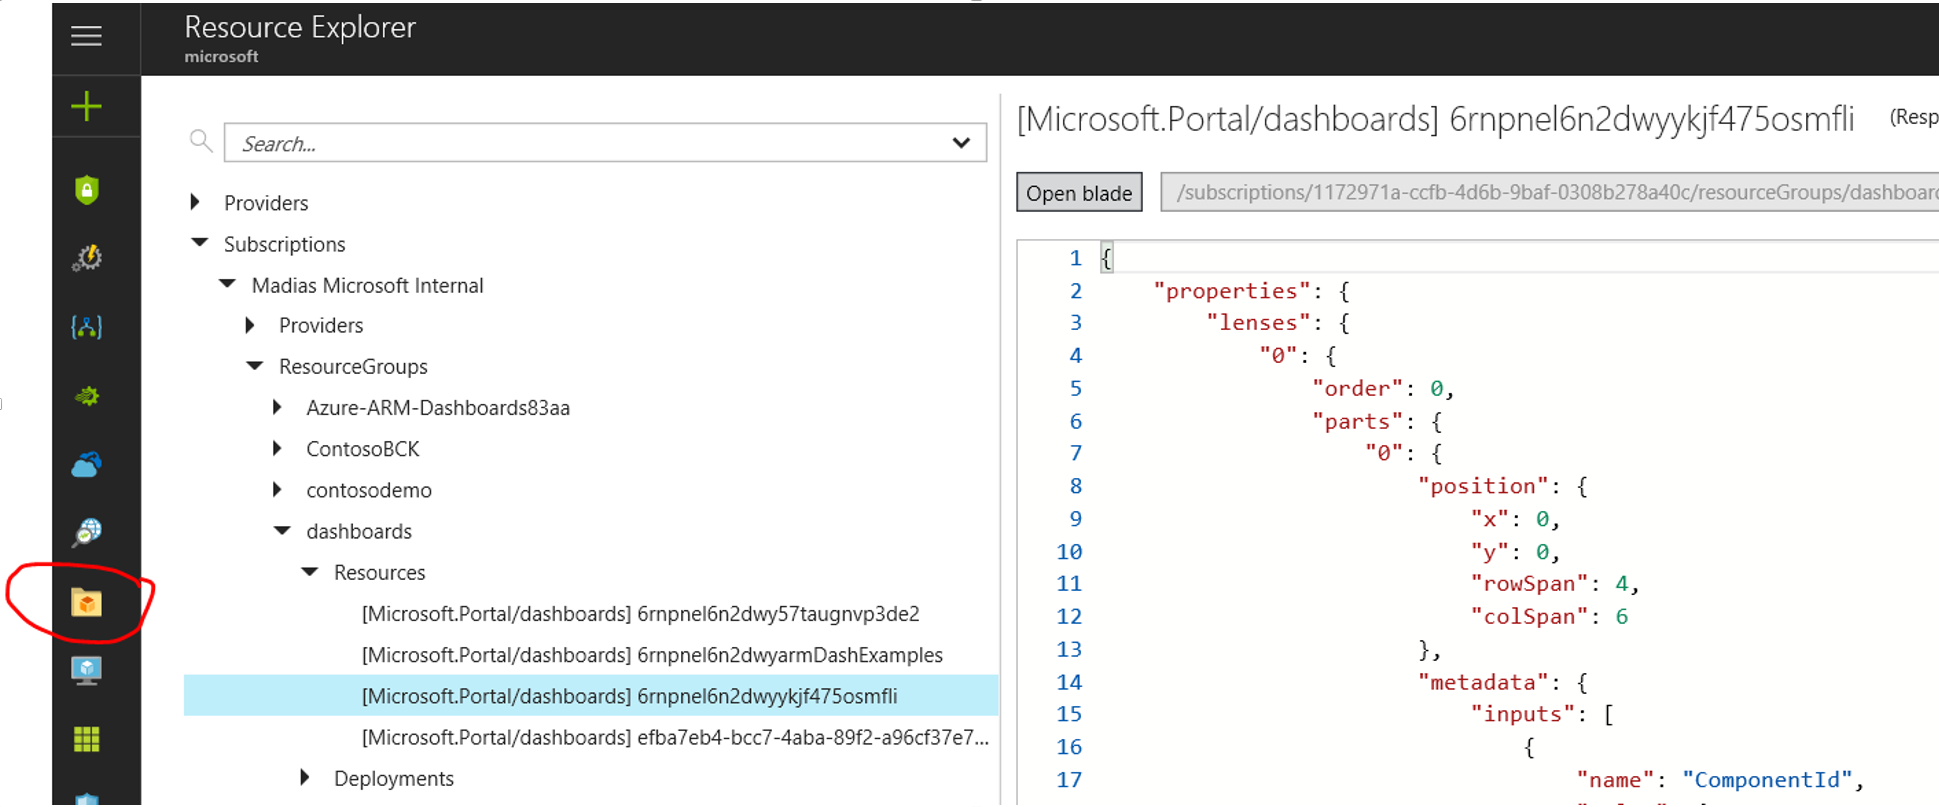
We need to open the dashboard definition and resource explorer can give us a hand:

Navigate to the created dashboard and grab the definition to a text/ARM editor of choice.
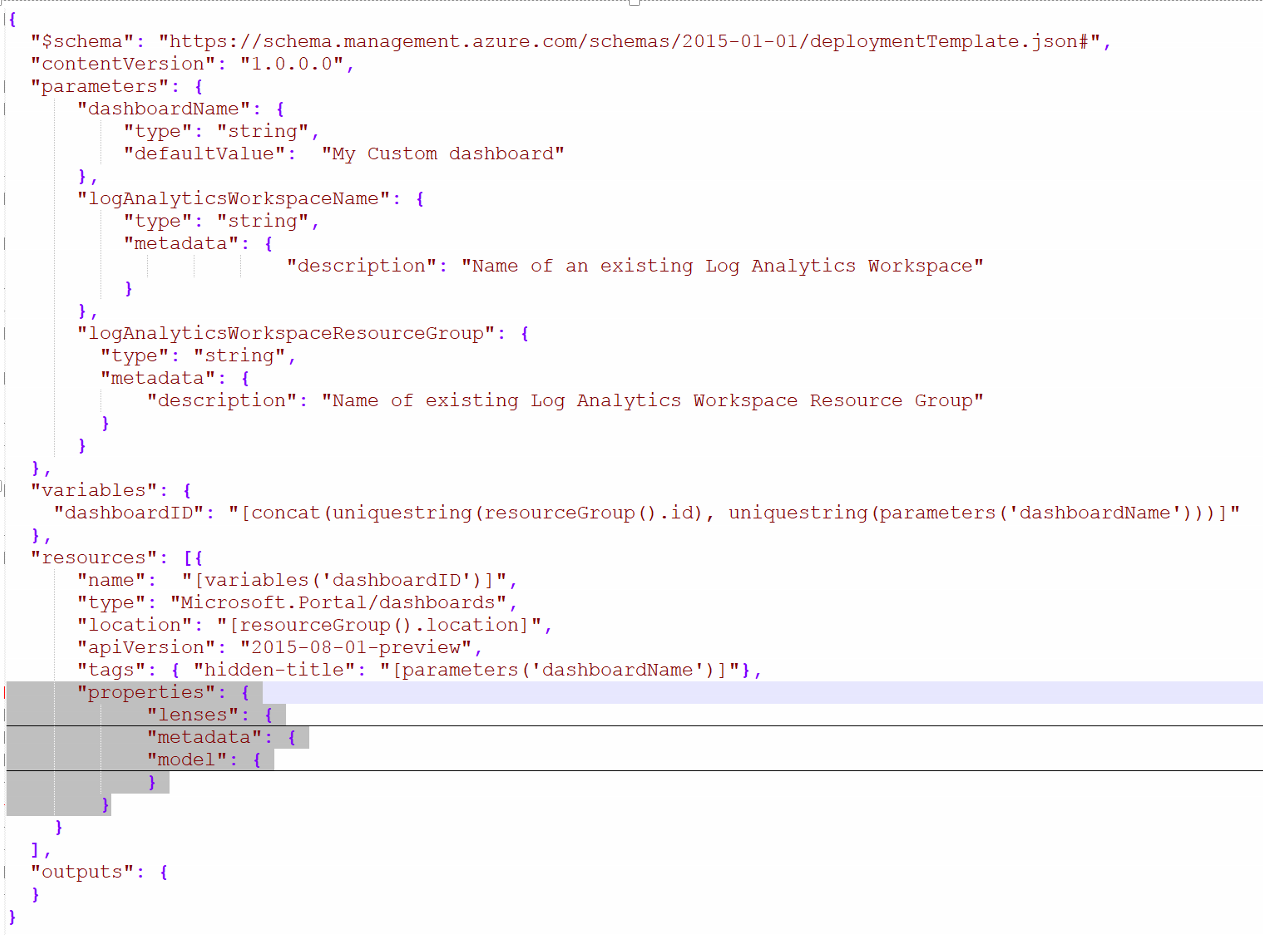
Create a new ARM template definition with parameters for requesting the dashboard Name, Log Analytics Workspace Name and location, a variable for generating a unique name and chose "2015-08-01-preview" as the API version.

Paste the previous grabbed dashboard from resource explorer into the resources tag and modify static values like so:
{
"name": "ComponentId",
"value": {
"SubscriptionId": "[subscription().subscriptionId]",
"ResourceGroup": "[parameters('logAnalyticsWorkspaceResourceGroup')]",
"Name": "[parameters('logAnalyticsWorkspaceName')]"
}
},
...
{
"name": "DashboardId",
"value": "[concat('/subscriptions/',subscription().subscriptionId,'/resourceGroups/',resourceGroup().Name,'/providers/Microsoft.Portal/dashboards/',variables('dashboardID'))]"
},
...
{
"name": "PartId",
"value": "[concat(uniquestring(variables('dashboardID')), 'Part1')]"
},
And that’s it!
Refer to this repo ( https://github.com/madiasOnGit/Azure.ARM.Dashboards/tree/master/KustoDashboardExample ) for the complete template.
Happy Dashboarding,
Marco