Setting Up Predictive Analytics Pipelines Using Azure SQL Data Warehouse
This post is by Robert Alexander, Solution Architect in the Data Group at Microsoft.
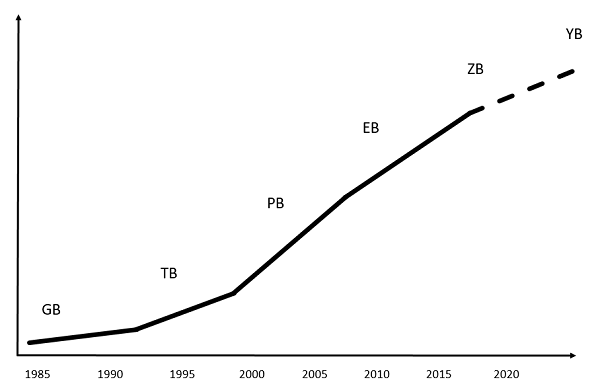
Big data is big and getting bigger. Better get used to a whole new set of prefixes beyond peta such as exa, zetta, and yotta. The total amount of data is projected to increase to about 50 zettabytes by 2020, as this graph shows:
The sheer size of data presents both immense opportunities and real challenges to businesses. Having access to mountains of data – from the internet of things, from applications in the cloud, from mobile devices – will enable businesses to drive faster and better decisions. The result? More real-time and user-specific actions, lower costs, lower risks, new products and services – even entirely new businesses.
But managing such vast amounts of data is no trivial matter and raises many questions. How to securely and reliably store the data? How to quickly move and collate data across organizational boundaries? How to efficiently analyze the data? How to find the right talent and technologies to handle the quickly evolving technological landscape? How to create the right architecture that fits within the IT budget? These are just some of the questions that must be answered.
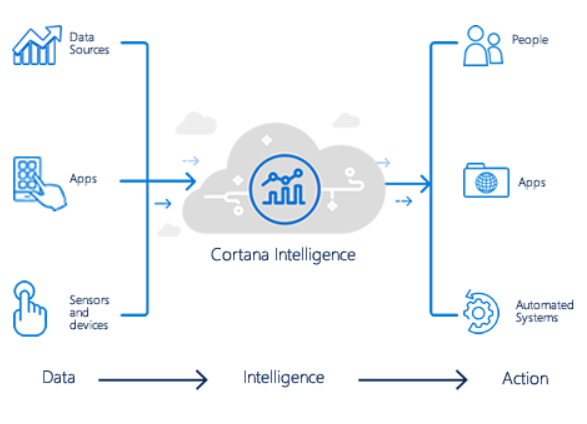
Microsoft has been hard at work building services and infrastructure in the big data space. The Cortana Intelligence Suite allows businesses to manage and make use of data at such scale. As a fully managed big data and advanced analytics suite, Cortana Intelligence is a powerful solution to transform your data into intelligent action. It consists of a number of services that can be used to create predictive analytics pipelines. Azure SQL Data Warehouse provides a cloud-based, scalable database capable of processing massive volumes of data. Azure Machine Learning provides a fully managed cloud service to easily build, deploy, and share predictive analytics solutions. In addition to these services, there are several others that are used to ingest, orchestrate, and visualize the data such as Azure Event Hub, Stream Analytics, Power BI, and Azure Data Factory.
Used together, these services can create powerful managed end-to-end data pipelines for ingesting, storing, analyzing and visualizing vast amounts of data. Real time pipelines can be created to allow data to be moved and analyzed in seconds where it can be used for alerting and operational statistics. Predictive pipelines can be created to allow large batches of data to be moved and analyzed in minutes where it can be used for insights.
To demonstrate the power of the Cortana Intelligence Suite we have published a tutorial that shows how to deploy an end-to-end fully operational real time and predictive pipeline in your Azure subscription. Along the way you will see in use all of the services listed above – as well as an on-premises SQL Server via a Data Management Gateway. Go check it out. You will learn how to add predictive pipelines to a data warehouse augmented with machine learning. At the end of this tutorial you will have a full end-to-end solution deployed in your Azure subscription.
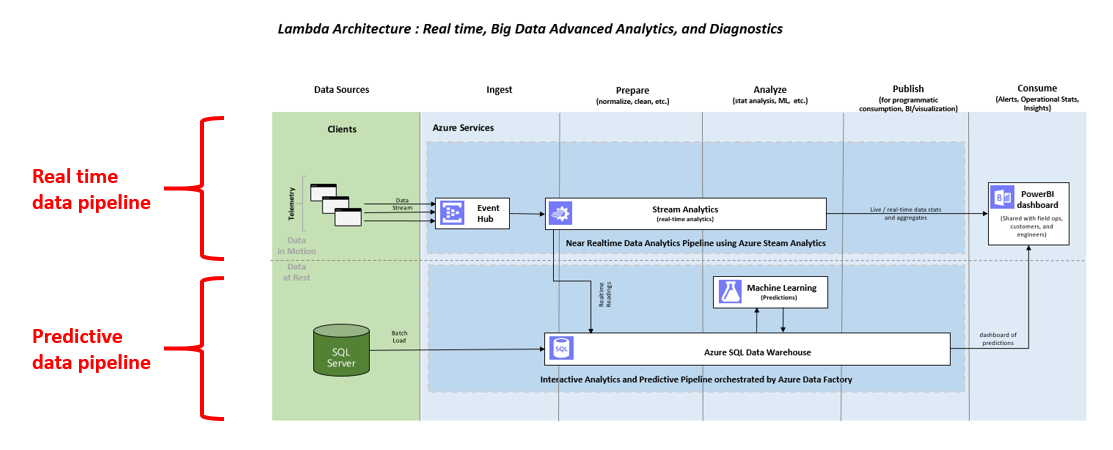
The underlying architecture is as follows:
This tutorial will cover several useful design patterns that you can use. It consists of a real time and a predictive pipeline. For the real time pipeline, you will see how Azure Stream Analytics can read from an EventHub and send the data to PowerBI for visualization. For the predictive pipeline, you will see how Stream Analytics can also send the data to Azure SQL Data Warehouse, where Azure Data Factory will call Azure ML to read the data from the warehouse and send the aggregated results back to the warehouse for visualization in PowerBI. In addition, you will see how historical batch data can be ingested from on-premises SQL Server via the Data Management Gateway to Azure SQL Data Warehouse.
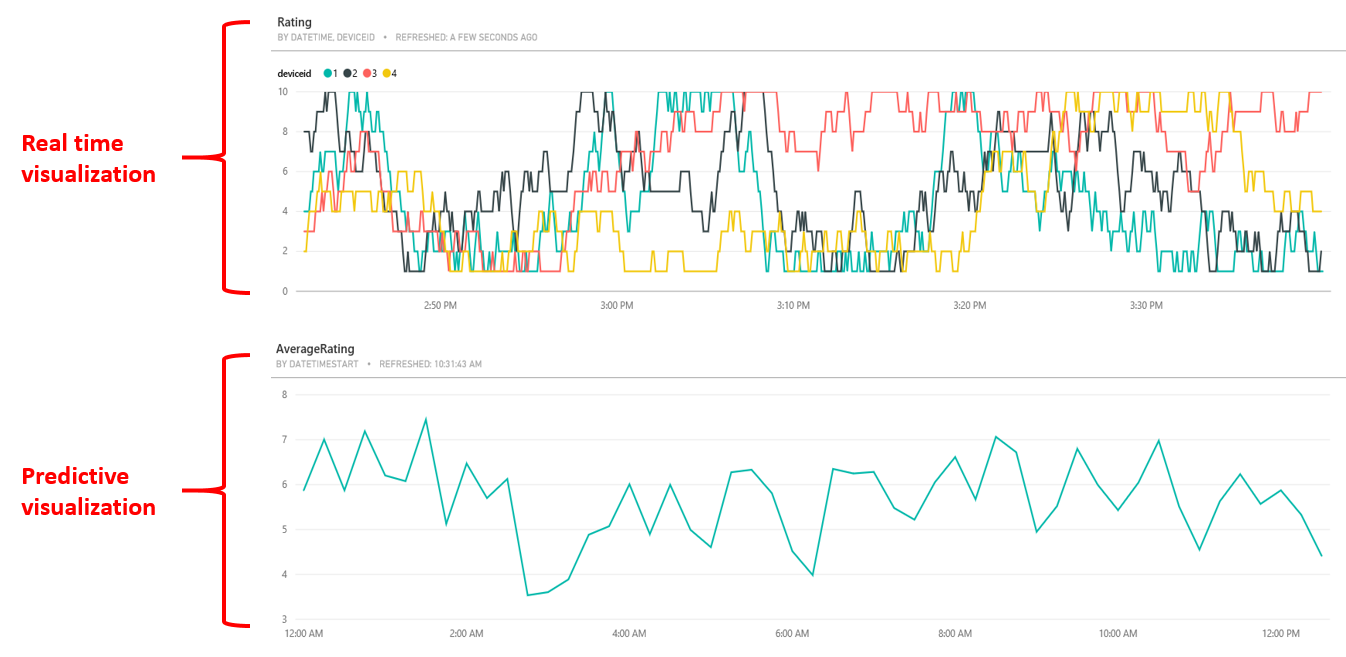
This tutorial simulates four different devices sending their rating of an event (e.g. a conference talk) every few seconds. When everything is successfully deployed and running, the final result will be a PowerBI dashboard showing the ratings of each individual device in seconds and the average rating for all devices every few minutes.
Click here to check out the tutorial and get started – and have fun with your journey into big data.
Here are all the Cortana Intelligence Suite services used by the tutorial: Azure SQL Data Warehouse | Azure Machine Learning | Azure Event Hub | Stream Analytics | Power BI | Azure Data Factory
Robert


