Azure App Service: Manually collect memory dumps
While troubleshooting web application performance issues we are sometimes required to gather memory dumps during the time of the issue.
In Azure App Service, we do not have RDP access to the machines. However, this doesn’t restrict us from gathering logs & data for troubleshooting. I am listing out few methods using which we can generate memory dumps of the process during the time of the issue.
Method 1: Using ProcDump.exe
Pre-Requisite: For this we need the sysinternals utility: ProcDump.exe
Azure App Service instances include the sysinternals suite in the default image. They can be located here via the KUDU console: D:\devtools\sysinternals
The users may also download ProcDump from here and upload it a specific location such as D:\home\LogFiles\Dumps and use it.
- Browse to the KUDU console
- Click on Process Explorer menu.
- There will be 2 w3wp.exe processes, one for SCM (KUDU) and another for the application.
- Note the PID (Process ID) of the w3wp.exe corresponding to the application (see the image above)
- Browse to Debug Console –> CMD
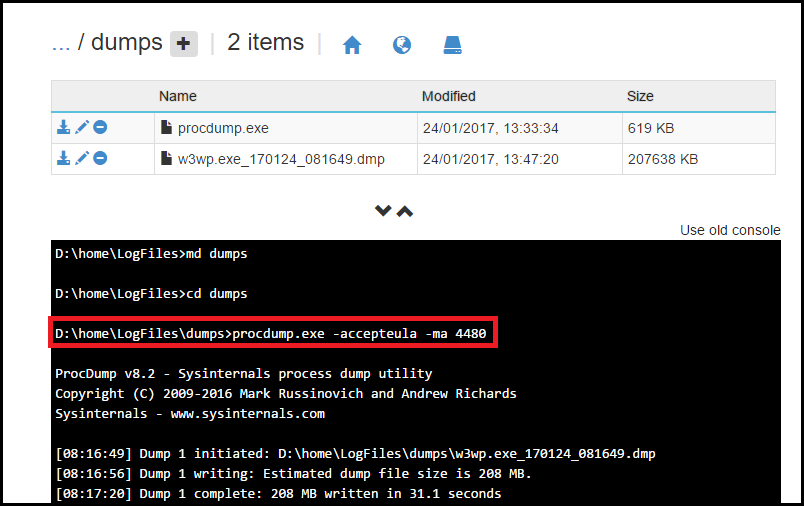
- In the command window, navigate to the dumps folder.
- Execute the following command to generate a full memory dump of the process
procdump.exe -accepteula –ma <PID of the process> where, -ma Write a dump file with all process memory. The default dump format only includes thread and handle information -accepteula Use this switch to automatically accept the Sysinternals license agreement.
Method 2: Using Diagnostics as a Service (DaaS)
Via Portal:
- Login to Azure portal. (https://portal.azure.com)
- Select the Azure Web App that you intend to troubleshoot
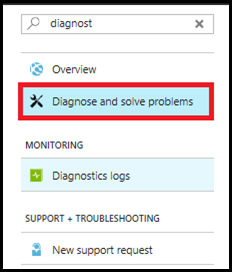
- Click on Diagnose and solve problems.
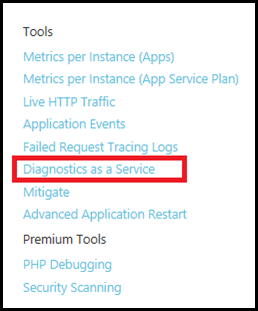
- In the new blade click on Diagnostics as a Service. (Bottom right side of the blade. )
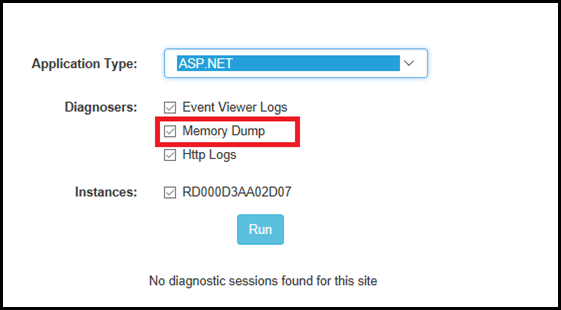
- In the new blade, set the following:
- Application Type – Depending on the type of application set the value to ASP.NET or PHP or Node.js.
- Diagnosers – Since this post is about collecting memory dumps, ensure that the check box against Memory Dump is selected. If you need Event Viewer Logs & Http Logs then you can enable them too.
- Instances – If the App Service Plan is configured to use more than one instance, then you can configure this to collect the logs on either multiple instance or specific instances.
- Click on Run to collect the logs. The blade will indicate the status of the operation and will also run analysis on the collected data.
- This puts the data under D:\home\data\DaaS\Logsfolder.
Via KUDU:
In scenarios, where the user may not have access to the portal, they can use Kudu to access DaaS. The option to select instances is not available here as KUDU by default connects to a specific instance. You can refer my previous post on this: How to connect to the Kudu site of a specific instance
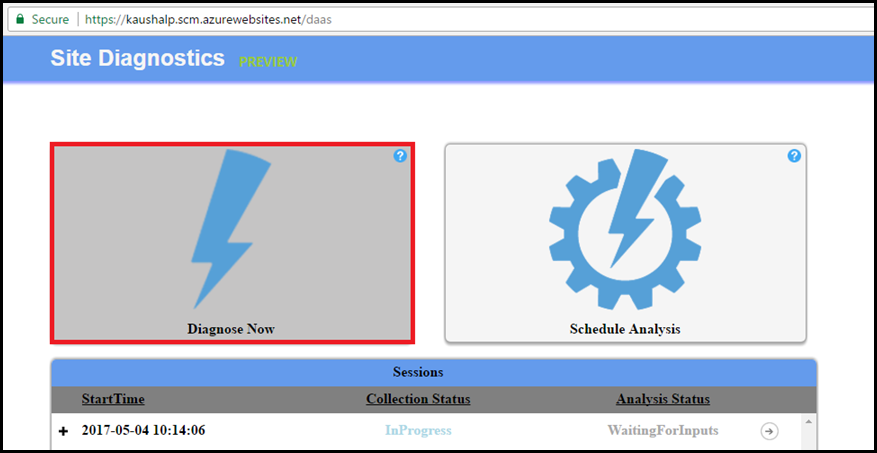
- Login to the KUDU console and append /daas to the path. (https://<yoursitename>.scm.azurewebsites.net/daas)
- This will launch the DaaS portal
- Reproduce the issue
- Click on Diagnose Now button as shown below:
- This will initiate logs collect.
- You can click on Schedule Analysis to select the logs that will be collected and whether you want to run an analysis on that.
More Information:
DaaS – Diagnostics as a Service for Azure Web Sites
New Updates to DaaS - Diagnostics as a Service for Azure Websites
Method 3: Using Process Explorer (KUDU) (least favorable)
This method is the least favorable as it generates the memory dump and the prompts the user to download it. If the download is interrupted due to some reason then the data is lost.
- Login to the KUDU console. (https://<yoursitename>.scm.azurewebsites.net)
- Click on Process Explorer menu
- There will be 2 w3wp.exe processes, one for SCM (KUDU) and another for the application.
- Reproduce the issue
- Right click the w3wp process (without the scm tag) and select Download memory dump –> Full Dump as shown below:
- Depending on the size of the process it will take couple of seconds or few minutes to generate the dump on the VM and prompt you to download the file
****IMPORTANT****
- Using Daas via portal is the preferable method. When the web app is scaled out to run on more than one instance, then you can use DaaS to collect the memory dump from a specific instance. Method 2 & 3 will generate memory dump on a specific instance and is not fool proof as the issue may or may not be occurring on the connected instance. You can however connect to the KUDU of a specific instance using my previous post here: How to connect to the Kudu site of a specific instance
- The downloading of the memory dump will contribute towards the outbound bandwidth of the App service plan. For more details refer: https://azure.microsoft.com/en-us/pricing/details/data-transfers/
- When the memory dump is being written, the process remains in a frozen state for the entire duration of operation. So this impacts the application’s availability.
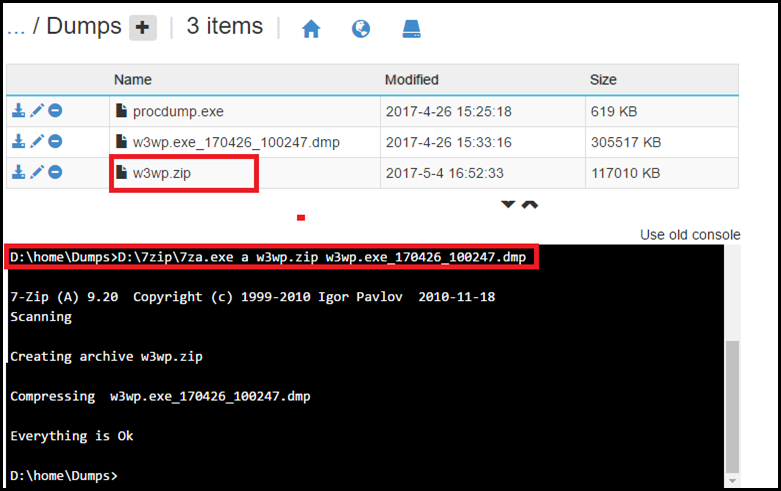
- You can compress the memory dump via 7zip which is availably by default on Azure App Service instances. You can run the following command:
D:\home\Logfiles\Dumps>D:\7zip\7za.exe a MemoryDumps.zip *.dmp
NOTE: Compression consumes CPU cycles, so you may want to re-consider when running this on a Small sized instance
Comments
- Anonymous
May 08, 2017
This is really great, tried all 3 methods on some web apps, works great.- Anonymous
June 13, 2017
Glad it helped you. :)
- Anonymous

