Using netsh to analyze WinInet problems in Windows 7 and Windows 8
There are some powerful tracing tools built into Windows 7 that can help you diagnose Internet Client issues. This walk though shows you now to enable tracing when accessing a web site using Internet Explorer 8 or other WinInet based applications.
Network tracing in Windows 7 (ref: https://msdn.microsoft.com/en-us/library/dd569136(VS.85).aspx) uses Event Tracing for Windows (ETW) (ref: https://msdn.microsoft.com/en-us/library/bb968803(VS.85).aspx) to enable you to see what is happening at the WinInet, Winsock, WebIO and TCP level. By looking at a simple example, you can see how this may be useful when analyzing http traffic.
1. Open an elevated command prompt by going to ‘Start’, ‘All Programs’, ‘Accessories’, Right click on ‘Command Prompt’ and choose ‘Run as administrator’
2. Type this into the command prompt: netsh trace start scenario = InternetClient level=5 tracefile=protocols.etl (Note: if you want netmon traffice too append capture = yes to the end of the command like this: netsh trace start scenario = InternetClient level=5 tracefile=protocols.etl capture=yes )
3. Open https://www.microsoft.com/protocols in Internet Explorer
4. After that page has rendered, stop tracing by typing into the command prompt window: netsh trace stop
5. Download and install the latest network monitor from https://www.microsoft.com/downloads/en/results.aspx?freetext=netmon&displaylang=en&stype=s_basic (version at the time of this publication is ‘Microsoft Network Monitor 3.3’)
6. Open the trace file in netmon from c:\windows\system32\protocols.etl
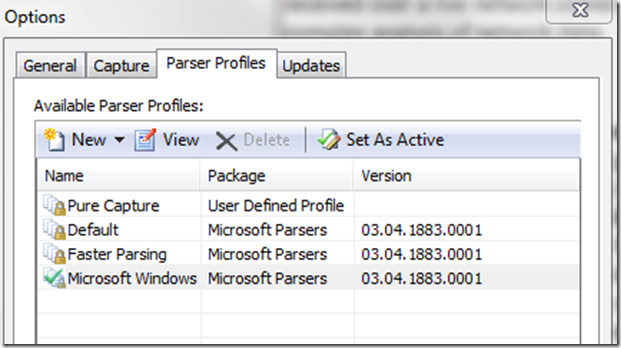
7. Install the full parsers in netmon by going to ‘Tools’, ‘Options’ then click on the ‘Parser Profiles’ tab, click on the ‘Microsoft Windows’ then choose ‘Set As Active’ and then ‘OK’ (see image below)
You should now be able to see WinInet, TCPIP and other traffic in the ‘Network Conversations’ window. To find the conversations with ‘protocols’ in the description, type this in the display filter: description.contains("protocols") and hit the Apply icon.
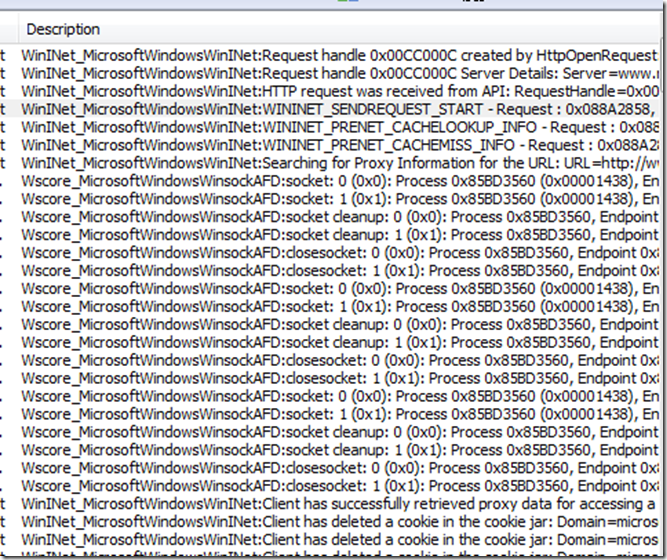
Here is where you can start to see the power of using netmon to analyze this data. You should see a description similar to: WinINet_MicrosoftWindowsWinINet:WININET_SENDREQUEST_START - Request : 0x078B3EF0, AddressName : https://www.microsoft.com/protocols
If you right click on this and choose ‘Find conversations’, ‘NetEvent’ you will see that the ‘Network Conversations’ is now highlighting the conversation associated with that request.
Remove the Display filter now so that you are not filtering by the description anymore. Once you do this you can see where there may be Cookie information, TCP information, WinInet connection information, TCP information, Http response information and other internal WinInet information.
Although there seems to be a mountain of information, you can use this to see what is different between a successful and failed case fairly quickly. The Description column is pretty good at describing what each of the frames are showing you. This will even let you see activity down to the WinSock level!
Try clicking on the other WinInet traffic links in the Network Conversations pane to see what other WinInet activity is occurring. You will see images being retrieved among other activity. This will give you very detailed look at what WinInet is doing during the time you took the trace.
Other tools are available to analyze the HTTP traffic. Fiddler (ref: https://fiddlertool.com ) is an excellent tool that can also allow you to see SSL content as well as performance metrics. You could also use Netmon directly to see network traffic. ETW tracing lets you see into what WinInet is doing however and will allow you a finer grained troubleshooting view along with the network traffic. You can use ETW tracing as another powerful tool in your arsenal to help with HTTP protocol troubleshooting. You can use ETW tracing to analyze HTTPS traffic as well. You cannot see all the content in clear text but you will notice the buffer in the WININET_HTTP_RESPONSE_HEADERS: HTTP Response Headers responses will show the beginnings of the data and show the headers in clear text.
Let me know if this post was useful to you!
Comments
Anonymous
December 17, 2013
Fantastic write-up. Thank you!Anonymous
May 06, 2014
Excellent! thank youAnonymous
September 16, 2014
Great post! very helpful, thank you


