Class Breakpoint: How to set a breakpoint on a C++ class in the Visual Studio Debugger
When debugging an application, there are times when you want the debugger to stop whenever any of the functions in a particular class are called. An example of this may be when you are trying to find out which object is calling your class. Of course, you could manually set a breakpoint on every function in your class but that is both tedious and time consuming, not to mention error prone (what if you miss one of the functions?)
What you really want is a "class breakpoint", that is, a breakpoint on an entire class and all its functions, operators, constructors, etc. In Visual Studio, you can set a "class breakpoint" using a function breakpoint. Specifically, when setting a function breakpoint, instead of specifying a function name, you can specify the name of the class followed by the '*' wildcard character. The '*' wildcard indicates to the debugger to break on "anything" that is called within the class.
Let's go through an example. In the following class declaration, I want to set a breakpoint on all methods in the Stack class.
 class Stack
{
private:
    list<int> m_list;
public:
    void push(int i);
    int pop();
    int depth() const;
    bool empty() const;
};
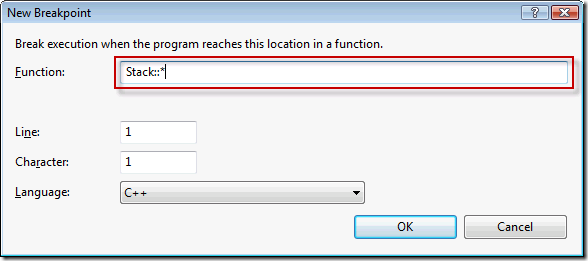
To do that, I can bring up the "New Breakpoint" dialog by pressing CTRL+B as shown below and type in Stack::* for the function name, as shown below.

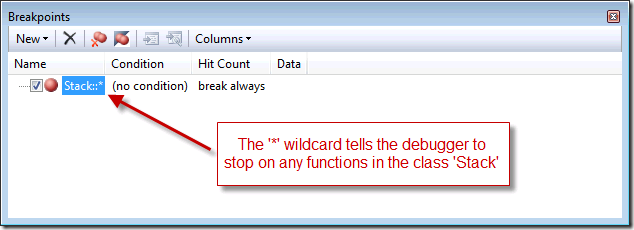
After setting the breakpoint, the Breakpoints window displays the new breakpoint just like any other breakpoint, as shown below.

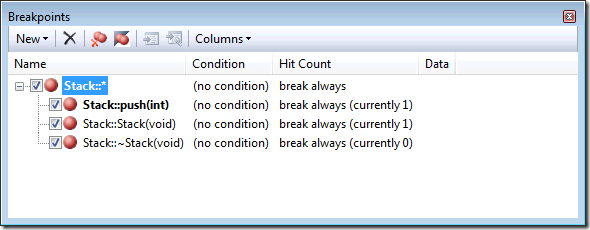
As soon as any of the functions in the Stack class are called, the debugger will stop at the function. Also, the Breakpoints window will show the fact that multiple breakpoints were set in the class. In the following screenshot, the function push() was called and the debugger stopped since there was a class breakpoint on the Stack class.

Habib Heydarian.