Analysis using "Pivot" - a preview by Jeff Jinnett
 Microsoft Live Labs recently introduced a private access beta version of the “Pivot” tool leveraging Windows 7, the Internet Explorer rendering engine and Silverlight. Access to the Pivot tool can be requested at https://getpivot.com. Pivot is a multimedia search tool that is designed to create very large “collections” of objects from the World Wide Web and then permit the user to visualize hidden patterns within the collections.
Since Pivot is based on the Seadragon technology, the user can zoom in or out on images while retaining image detail. Try Seadragon for yourself by clicking here:
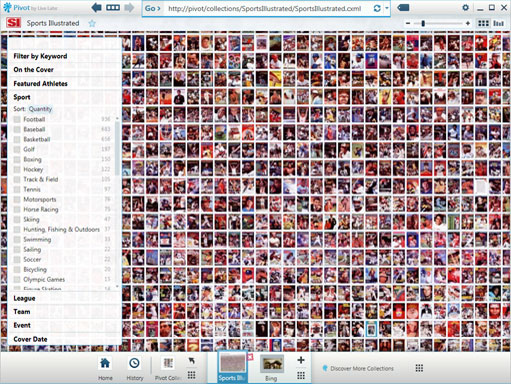
Pivot enables the user to view the web as a web rather than as isolated pages. For example, a user can create a “collection” of Sports Illustrated covers and then sort them based on type of sport, team or other search criteria.
You can watch a demo by clicking here:
Although Pivot appears to have been primarily designed for consumer use to produce an richer Internet experience, some beta testers of Pivot have proposed that Pivot could have considerable value in the business intelligence space (e.g., to generate a mashup Pivot view of the Crunchbase database ) and in the e-learning space. If these beta testers are correct, it might be valuable also to seek out potential applications of Pivot for creating large “collections” of risk and/or compliance data and then using Pivot to create better search visualizations of the hidden patterns within the data collections. Possible areas of interest could include:
• Analysis of business processes subject to HIPAA within “hybrid” entities, such as insurance companies marketing both life insurance and health insurance
• Analysis of security breach incident logs
• Analysis of portfolio assets subject to multi-agency regulatory oversight
• Analysis of counterparty risk profiles and data
Given the complexity and size of risk and compliance databases and the movement toward real-time analysis of risk data, Pivot could prove useful in rendering data more understandable from a visual point of view. Check it out and let me know if you agree.