Send Telemetry to Splunk Enterprise from Azure Resources via Azure Monitor, Part 5
For Part 1 of this blog series, which contains overview material, please click here.
There are several scenarios that must be addressed when thinking about getting telemetry from Azure resources to Splunk. What if Splunk is on premises? What if you’re using Splunk Cloud? You could be using a private network connection to Azure, or not. The Splunk add-on approach isn’t suited to all of these. In this blog and others in this series, I’ll introduce some new architectural elements and go into detail on each.
In this article, “the add-on” refers to this.
These specific scenarios will be dealt with:
- Cloud-based Splunk, using the add-on (Part 2)
- Cloud-based Splunk, using the HTTP Event Collector (Part 3)
- Premises-based Splunk, using private network (Part 4)
- Premises-based Splunk, via the internet (this article)
In this, Part 5, I’ll go into Premises-based Splunk via the internet.
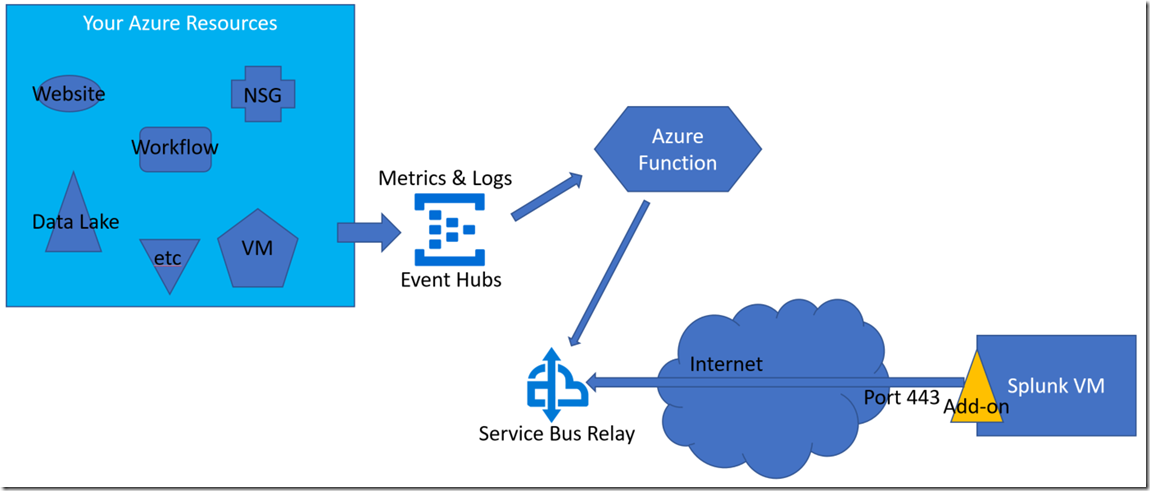
In this configuration, Splunk is on prem, behind a firewall and no private network, but no proxy server so the Splunk server can see to resolve names over the internet through port 443.
The solution is another Azure service: Azure Relay. With Azure Relay, the Splunk server takes the “listener” role and establishes an “open phone line” in the cloud via a call over port 443. The “sender” role is played by an Azure Function which can see that open phone line and establish a channel for communications over it.
The components that you need to get going with this are:
- Azure Function for Splunk, located here.
- A Splunk add-on that knows how to work with Azure Relay. That’s here.
In this case, the Azure Function should be configured to run with the Relay output binding. The installation instructions in the README.md covers those details.
