Taking Your Financial Reports to the Next Level with Management Reporter – Financial Matrix (8 of 8)
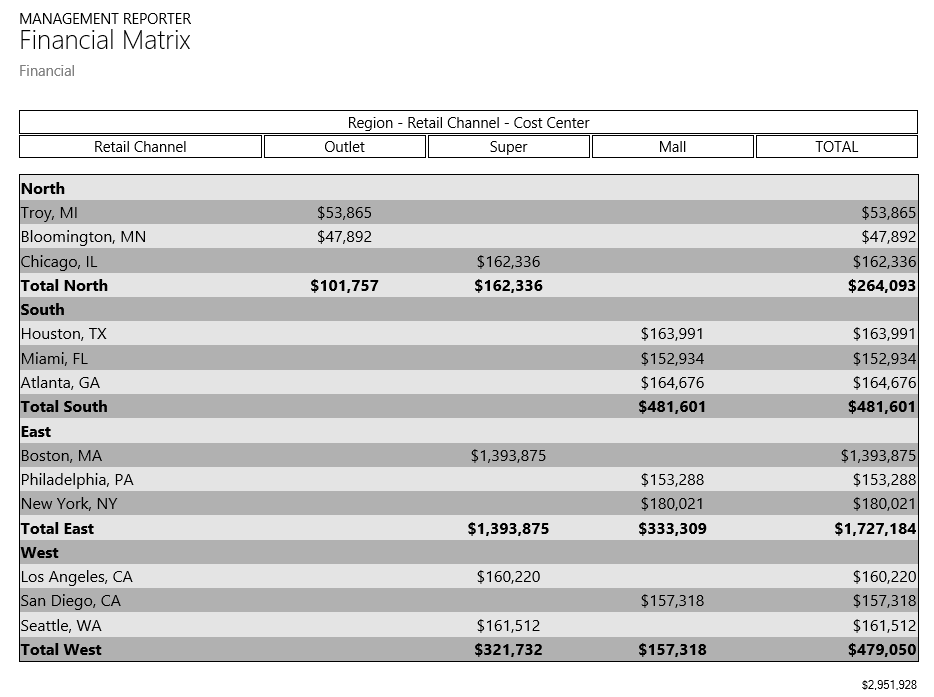
The final report in the “Taking your Financial Reports to the Next Level with Management Reporter” series is called “Financial Matrix.” A senior leader in the company needs to be able to see how all of his retail channels are performing. The financial matrix gives him a high level view of each retail channel by cost center and region. He can immediately see what regions and channels are under performing. He can then take that information to those responsible for those areas to start working on a strategy for improving their performance.
The rows of the report display the retail channels by region and the columns in the column definition are filtered to the different cost centers. Formatting is used to distinguish the rows of data and provide a clear view of what’s included in the report. 
This video includes information on how to create a similar “Financial Matrix” report for your company.
[embed]https://www.youtube.com/watch?v=ObyW_80MtKA&feature=youtu.be[/embed]
In summary, the key features included in the “Financial Matrix” were:
- Dimension based rows in the row definition, no main account specified
- Dimension filters in the column definition
- Shading and other formatting options to distinguish data
Links to other posts in this series:
- Quarterly Revenue by Business Unit - Are we making a profit?
- Weekly Material Usage - Are we being efficient?
- Budget to Target - Are we hitting targets?
- Postings Audit - Are we entering transaction accurately?
- Statement of Cash Flow - Are we making the right investments?
- Quarterly Tax Form - Are we getting the data needed for taxes?
- Financial Matrix - How are we performing?