Support Debugging Tool Build 16 released

A week into the New Year and no posts.... what's happening? Read on to understand where all my spare time has been going....
After over four months of development, testing and documentation, I am thrilled to announce that build 16 of the Support Debugging Tool is now available for download from PartnerSource. This build has over 50 changes and focuses on functionality for logging and debugging issues with Microsoft Dynamics GP, while still having some improvements for the database or application Administrator.
A quick hint about how much is included in this build is that the User Guide PDF has grown from 161 pages to 193 pages.
Highlights include:
- Macro Recording Logging
- SQL Profile Tracing Logging
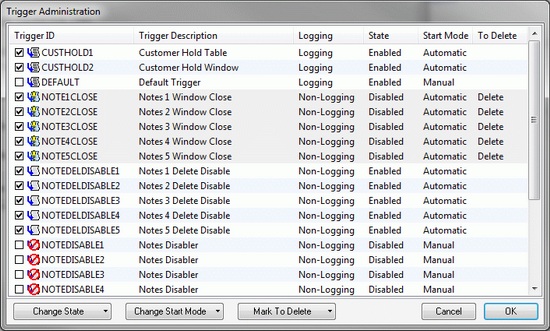
- Improved Trigger functionality including a Trigger Administration window
- SQL Role Views from the Security Information window
Below is a summary of the changes made for releases 10.00.0016 and 11.00.0016, I have divided them into logical sections:
Fixes
- Fixed Security Information Show Resources not displaying when a Security Role not assigned to any users was selected.
- Fixed Logs, screenshots and table/record dumps being overwritten when new logs started in the same second by adding suffix to filename.
- Update Trigger handling to allow Restore Value option to work for Text Field datatypes.
- Fixed Security Privilege errors for non Dictionary Resource Security Objects not being logged when Security Profiler is running in the background.
- Fixed Manual stopping of non-logging triggers using MBS_Trigger_Stop helper function not working.
- Fixed Field Physical Name search in Resource Information window to handle Composite and Array fields correctly.
- Fixed Tables Containing Field Lookup in Resource Explorer to handle Composite and Array fields.
- Fixed Screenshot not being able to save image files to a UNC pathname. Files now saved to temp and moved to UNC Path.
- Added check to see if email system is in use when emailing Screenshots as part of processing a trigger.
Enhancements
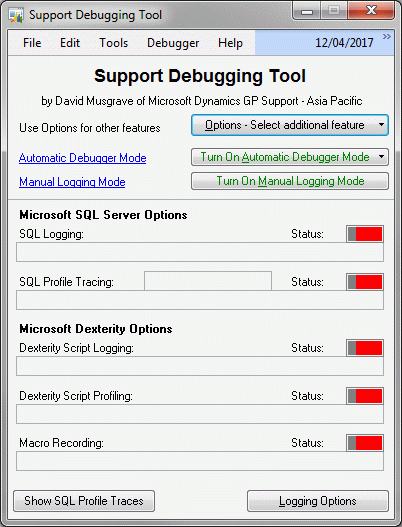
- Updated Support Debugging Tool main window to move Logging Options to a sub window and just show current status.
- Added optional display of form details when Security Privileges error is displayed to Administrator Settings.
- Added Table restricted to Table Trigger Type to Automatic Debugger Mode to provide form restricted database triggers.
- Added Focus Event with Table Trigger Type to Automatic Debugger Mode to provide access to a specified table buffer from the form.
- Added Form Menu Trigger Type to Automatic Debugger Mode.
- Added Minimize Debugger Log Entries for use with Automatic Debugger Mode Non-Logging Triggers to avoid writing to the Debugger Log.
- Add option to Exclude Selected Users on Automatic Debugger Mode Triggers rather than include selected users.
- Added option to control which logging modes are restarted when Automatic Debugger Mode trigger fires.
- Added MBS_Logging_Start and MBS_Logging_Stop helper functions to programattically turn on and off Manual Logging Mode.
- Updated ScreenShot's System Status report with Debugger Version and Settings folder, SQL Session SPID, and fixed Data Folder Path.
- Added HOMEDRIVE and HOMEPATH Environment Variables to ScreenShot's System Summary Report.
- Added Physical Memory Status to Screenshot's System Status Report.
- Added Database information about System and Company Databases to ScreenShot's System Status report.
- Added Dex.ini Setting MouseWheel to the Other tab of the Dex.ini Settings window.
- Added MBS_Debug_LogAppDetails Dex.ini Setting to log details of the current application, available from Startup tab of Dex.ini Settings window.
- Added Export to File or Email option to Tables Containing Field Lookup in Resources Explorer.
- Added Export to File or Email option to Associated Tables Lookup in Resources Explorer.
Performance
- Added performance enhancements to reading of the debugger.xml setup file using ctree caching files.
- Improved performance for XML Export, Resource Information and Resource Explorer windows when displaying the number of records in tables.
Usability
- Extended Automatic Debugger Mode Trigger Name field size from 30 to 60 characters and updated windows and reports to match.
- Extended Runtime Execute Script Name field size from 30 to 60 characters and updated windows and reports to match.
- Extended SQL Execute Script Name field size from 30 to 60 characters and updated windows and reports to match.
- Extended XML Export Profile Name field size from 30 to 60 characters and updated windows and reports to match.
- Added smart positioning for initial position of Support Debugging Tool main window based on primary screen resolution.
- Added smart positioning for initial position of Automatic Debugger Mode Status window based on primary screen resolution.
- Added Window Position Memory to Automatic Debugger Mode Status window using MBS_Debug_WinDebuggerStatus Dex.ini setting.
- Added separate Auto Open setting to automatically open the Support Debugging Tool main window after login, previously was controled by Debugger Setup Mode setting.
- Added checks for Logging Paths selection to check folder exists and has write access.
- Added highlighting of Linked Table on the Associated Table Lookup for a Form in Resource Explorer.
- Updated Automatic Debugger Mode Trigger Administration and Configuration Export/Import windows to show non-logging triggers with a different icon.
Features
- Added Macro Recording Facility to Individual Logging, Manual Logging Mode and Automatic Debugger Mode.
- Added check for MouseWheel=FALSE on version 10.0 and disable Macro Recording if Mouse Scroll Wheel not disabled.
- Added SQL Profile Tracing Facility to Individual Logging, Manual Logging Mode and Automatic Debugger Mode.
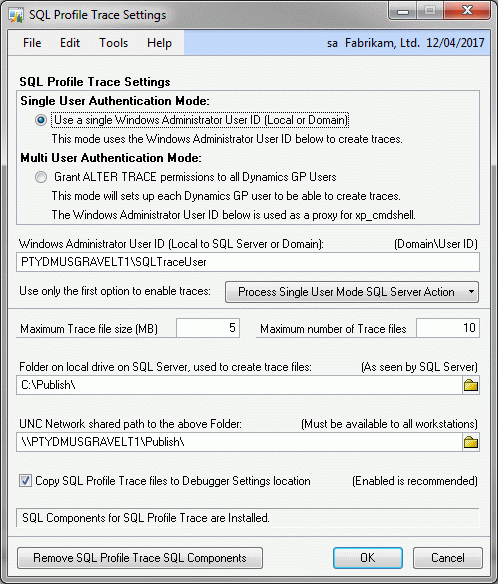
- Add features to Administrator Settings to configure, create and remove SQL Profile Tracing SQL Components.
- Added Support for SQL Profile Tracing to specify Maximum Trace File Size and Maximum Number of Trace Files.
- Added Version Control Checking for SQL Profile Tracing Stored Procedures to ensure SQL Tracing is only enabled when latest stored procedures are installed.
- Added Check for SQL version to ensure that SQL Profile Tracing Events not compatible with SQL Server 2005 are excluded from the stored Procedures.
- Added SQL Profile Trace SQL Components and permissions cleanup into un-install feature.
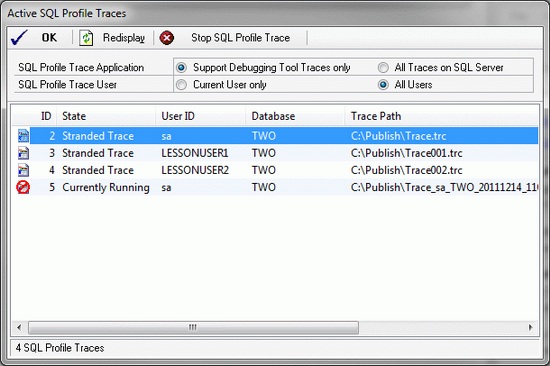
- Added Detection and cleanup of stranded SQL Profile Traces on login.
- Added SQL Profile Trace List window to display active traces and allow for stopping of stranded traces.
- Added Trigger Administration Window for quick changes to delete, enable/disable or change start mode of triggers.
- Added by User, by Database and by Role SQL Server Roles Views to right hand pane of Security Information Window.
Diagnostics
- Reserve Tilde (~) prefix for Trigger IDs, Script IDs and Profile IDs for use by Microsoft Support.
- Added Automation Functionality for use by Microsoft Support. Added Dex.ini settings MBS_Debug_Automate_File, MBS_Debug_Automate_Script, MBS_Debug_Automate_Status.
- Added Additional User Confirmation Dialogs for Microsoft Support Diagnostics.
Downloads
For downloads, please see the Support Debugging Tool Portal Page:
Support Information
The Support Debugging Tool is a custom built tool to provide additional capabilities to troubleshoot issues and is not part of the standard Microsoft Dynamics GP released application. Technical support for this tool is not handled via the standard support systems and instead is provided via the public Microsoft Dynamics GP Community Forum. You can use the link below to access the forum:
To assist the partners and Microsoft employees who monitor the forum for these questions, please prefix any subject lines with the initials "SDT: ".
More Information
For more information, please see the Support Debugging Tool Portal Page:
Please post your feedback on what you think of this build and what you would like to see in the future.
Thanks to Mariano Gomez, Robert Cavill and especially Sivakumar Venkataraman and Allan Cahill for their efforts in testing all the new features to make sure they worked as desired. Thanks also to Kelly Youells for getting the files and PartnerSource pages updated.
David
16-May-2013: Updated More Information and Downloads to link to Support Debugging Tool Portal page.
Comments
Anonymous
January 05, 2012
Thanks David for a detailed post on it. Its really useful. RavishankarAnonymous
January 05, 2012
Posting by Sivakumar Venkataraman at Interesting Findings & Knowledge Sharing msdynamicstips.com/.../support-debugging-toolbuild-16-available-nowAnonymous
January 05, 2012
The comment has been removedAnonymous
January 12, 2012
Posting by Mark Polino at DynamicAccounting.net msdynamicsgp.blogspot.com/.../support-debugging-tool-build-16.htmlAnonymous
January 12, 2012
Posting by Vaidy Mohan at Microsoft Dynamics GP - Learn & Discuss www.vaidy-dyngp.com/.../support-debugging-tool-sdt-v110-build.htmlAnonymous
January 12, 2012
Posting by Jay Manley at Inside Dynamics GP blogs.msdn.com/.../support-debugging-tool-build-16-released.aspxAnonymous
January 12, 2012
Posting by David Bader at Dynamics GP Support and Services Blog blogs.msdn.com/.../support-debugging-tool-build-16-has-been-released.aspxAnonymous
January 12, 2012
Posting by Samuel Mathew at Microsoft Dynamics GP Discussion smathew-gpblog.com/.../support-debugging-tool-build-16-releasedAnonymous
January 12, 2012
Posting from Jivtesh Singh at About Dynamics, Development and Life www.jivtesh.com/.../happy-new-year-and-gift.htmlAnonymous
January 18, 2012
Posting by Mariano Gomez, The Dynamics GP Blogster dynamicsgpblogster.blogspot.com/.../support-debugging-tool-on-twitter.htmlAnonymous
January 26, 2012
Hello David, Is there any way i can view the security Report/ information from support debugging tool. eg. ( I have sales entry batch window Modified ) i would like to have the users id's = sales entry batch window. (users those have access to this modified window) Thanks.Anonymous
January 26, 2012
Hi Riaz Use the Security Information window. Select the Sales Batch Entry window on the left hand pane. For the currently selected user, the left hand pane will show how access was granted. On the right hand pane, look at the checkboxes to see which users have access. DavidAnonymous
May 31, 2012
Hi David, Can you please tell if SDT can be configured to automatically save screenshot of a window (the save dialog is not opened)?Anonymous
May 31, 2012
Hi Tina Yes, you can create a non-logging trigger to run based on a specified event to capture all the open windows and either email or save them. It would help if you could provide the "big picture" of what you are trying to achieve as the tool has lots of different ways to do various things. DavidAnonymous
June 04, 2012
The comment has been removedAnonymous
June 06, 2012
Tina Why use prntscrn when the SDT has the ScreenShot tool built in? DavidAnonymous
June 06, 2012
Hi David, When we use Ctrl+ S or SDT Screenshot shortcut, save dialog opens prompting to save the screenshot. How to stop this save window? Save the screenshot at some predefined location automatically. Please guide. TinaAnonymous
June 06, 2012
Hi Tina You need to create a non logging trigger to run on the event you want to use. change the script return OUT_Condition = true, or check the perform action if conditions not met. Then select capture screenshots as one action performed with the trigger fires. This will capture screen shots without user interaction. DavidAnonymous
June 12, 2012
Wonderful Thanks David!! Tina


