[PowerShell Script] Isolating the Threads Consuming High CPU
When helping my customers with scenarios in which the symptom is high CPU, I very often end up with only a dump file from the application consuming high CPU and nothing else.
When you have a high CPU scenario and you have dump files, you need a Performance Monitor log in order to see the threads consuming high CPU. If you don’t have Performance Monitor logs, then you can use Process Explorer, Task Manager or any other similar tool.
Let me explain why Performance Monitor is a key tool for high CPU issues; using Performance Monitor you can isolate the process consuming high CPU, and then you can select the Thread object, use the % Processor Time counter to locate the threads consuming high CPU, and, finally, use the ID Thread counter to get the thread ID number by using the Average column.
After that, you convert the decimal value to hexadecimal and you get the thread id in the same form as WinDbg.
Then you open the dump and analyze the threads you isolated using Performance Monitor.
Everybody is happy and life is great! J
Back to the trenches; sometimes we just don’t have the Performance Monitor log because it was not collected during the moment the dump was collected, or because the Murphy’s Law was present during your troubleshooting and [you fill in the blank] went wrong.
Under this scenario you have much more technical work to find out the threads consuming high CPU.
The algorithm for isolating high CPU threads when doing live debug or analyzing a dump file is:
a) Verify if the threads actually have high CPU time.
b) If a) is true, identify if most of the CPU time comes from User mode or Kernel mode. In most cases the User mode time is higher than the Kernel mode time.
c) After that, select the threads consuming User time or Kernel time for more than “n” seconds or minutes, according to the description of the symptom. For example, if the user complains that his/her application is consuming 100% CPU time for more than 2 minutes we don’t want to see the threads consuming CPU time for, let’s say, less than 1 minute.
d) Investigate the call stack for each thread to understand if the thread is actually doing work or waiting for work. This is the most difficult part because you need to be familiar with APIs, and it takes time to analyze each thread.
Here I need to give a reminder: the fact you have threads with high CPU time doesn’t mean they are consuming high CPU!
Example: You may have a thread calling the Sleep() API using 500 milliseconds as argument. This thread may end up executing for a long time, but it is not the kind of thread that should cause a 100% CPU symptom. When using the Sleep(500) we give a rest to the thread and to the processor.
This is the reason for this script! The PowerDbgScriptHighCPU does this heavy work and presents the threads consuming high CPU, for any process running native or managed codes.
Upon finishing the script sends a message.
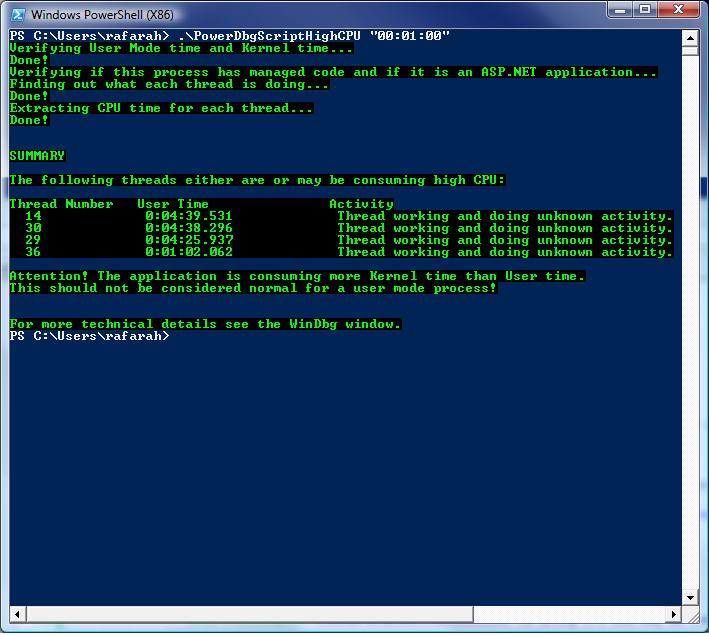
Then the PowerShell window shows you the threads consuming high CPU and what they are doing. The Windbg window gives you hyperlinks to get details about the threads consuming high CPU and modules.
Even if you have the Performance Monitor log you may want to use this script just to save time.
This script uses the cmdlet Classify-PowerDbgThreads. This cmdlet is the kernel of this script. You can easily improve this cmdlet and create more specific scripts that use it to diagnose other problems like hangs, exceptions, specific component operations, etc…
My partner on this little toy is Mike McIntyre, a highly skilled Escalation Engineer from the Sharepoint CPR team.
I had the pleasure to meet the Support Escalation Engineers and Escalation Engineers from the Sharepoint CPR (Critical Problem Resolution) a few months ago and I can tell you I’m a big fan of theirs! They are a small team that handles highly complex customer problems here.
It should be no surprise for you to know it was an honor for me to work with Mike McIntyre on this script!
These are the screenshots:
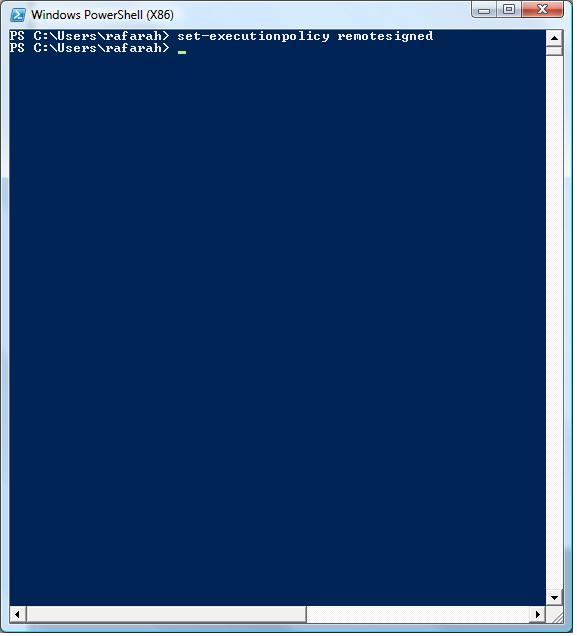
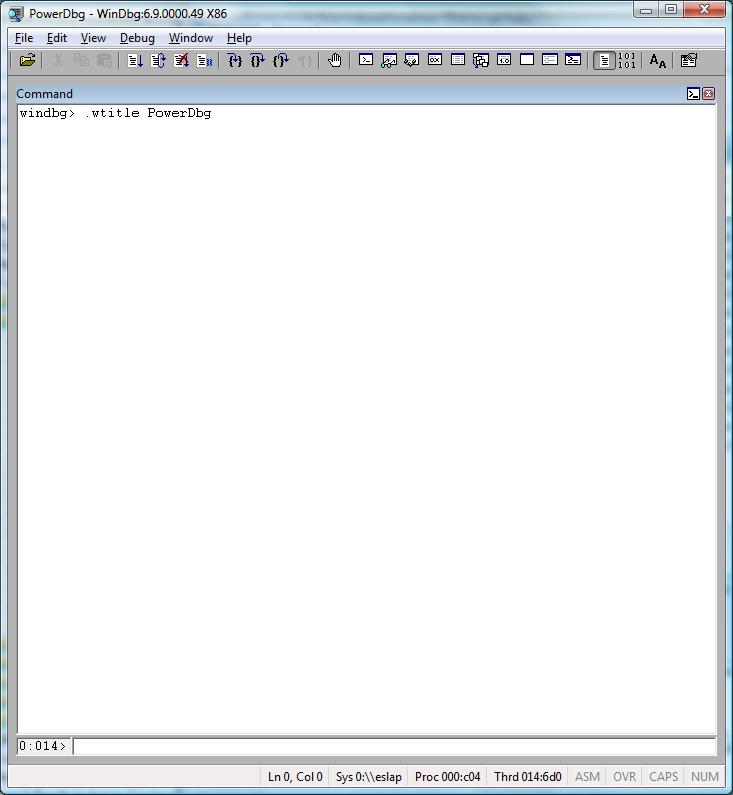
Attention! It’s better to use .reload /f instead of .reload to avoid delays when executing the k command and its variations. This delay may cause errors because the script may continue the execution while the WinDbg command is still running.
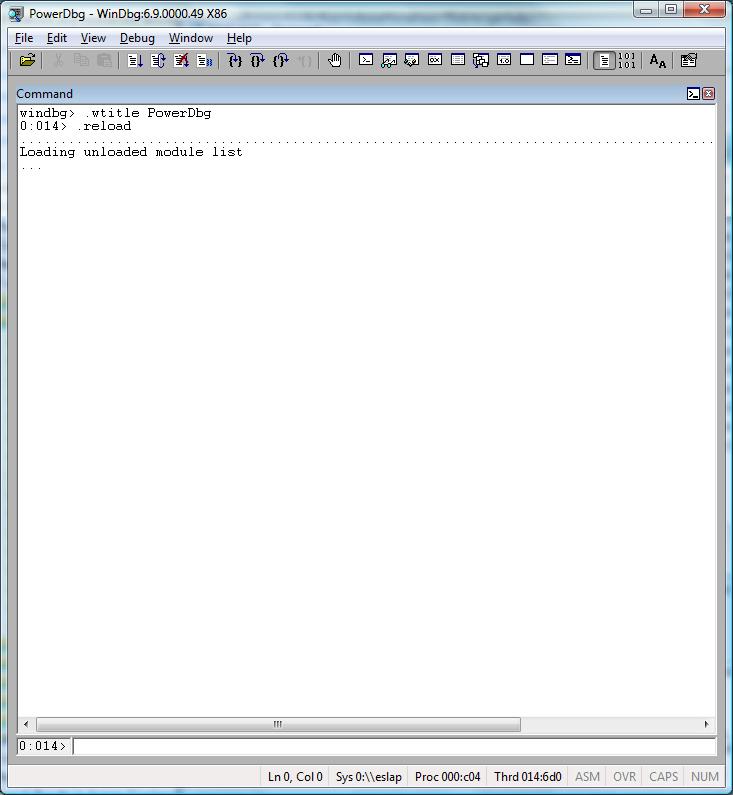



Attention! Before running this and any other script, make sure you are using the latest version of the PowerDbg library, then do this:
a) Change the WinDbg title using: .wtitle PowerDbg
b) Load SOS.dll
c) Load all symbols: .reload
If you don’t reload the symbols, they will be solved during the time the script is running, which might cause timing issues with the script.
If you don’t load SOS.dll the script won’t be able to use it.
We don’t load it from the script because it has some particularities that may affect different users, although it’s possible to change the script and do that if you want.
Hey, you have the source code, come on! J
Another thing: the script default threshold is 10 seconds. You should use a threshold that is close to the time when the application begun consuming high CPU; otherwise you may end up with false positives.
For example, if the application is consuming high CPU for over 3 minutes you may want to use “00:01:30” as argument.
This is the source code for PowerDbgScriptHighCPU.ps1:
########################################################################################################
# Script: PowerDbgScriptHighCPU
#
# Parameters: [string] [$timeLimit]
# Minimum time limit for threads consuming high CPU.
# This argument is optional. If you don't provide it the script will use 10 seconds.
# The format must be "hh:mm:ss"
# The threads to be analyzed will be those consuming CPU time >= $timeLimit.
#
# Purpose: Show the threads consuming high CPU and details about them. Works for managed and native codes.
# It warns user if Kernel time is higher than User time.
# For managed code, make sure you loaded SOS.DLL extension before using this script.
#
# Attention! This is for 32 bits.
#
# Usage: Before running the script:
# a) Open your workspace to load the symbols.
# b) .wtitle PowerDbg
# c) .reload
#
# Attention! If you don't load the symbols before running the script you may face timing issues.
#
# Changes History:
#
# Mike McIntyre
# Roberto Alexis Farah
# All my functions are provided "AS IS" with no warranties, and confer no rights.
########################################################################################################
param(
[string] $timeLimit = "00:00:10"
)
set-psdebug -strict
$ErrorActionPreference = "stop"
trap {"Error message: $_"}
write-Host "Verifying User Mode time and Kernel time..." -foreground Green -background Black
# If you want you can create code to load SOS.DLL extension if necessary.
# Here I'm assuming this extension was already loaded.
Send-PowerDbgCommand("vertarget")
# Extracts output from previous command.
Parse-PowerDbgVERTARGET
# Converts CSV file to Hash Table.
$output = @{}
$output = Convert-PowerDbgCSVtoHashTable
# The flag will be true if Kernel time is greater than User time.
$isKernelTimeHigher = $([System.DateTime] $output["Kernel time:"]) -gt $([System.DateTime] $output["User time:"])
write-Host "Done!" -foreground Green -background Black
$hasASPXApplication = $false
$hasManagedCode = $false # If the flag above is true this flag must be true too. ;-)
write-Host "Verifying if this process has managed code and if it is an ASP.NET application..." -foreground Green -background Black
# Gets module names.
Send-PowerDbgCommand "lm1m"
# Parses output.
Parse-PowerDbgLM1M
# Converts CSV file to Hash Table.
$output = @{}
$output = Convert-PowerDbgCSVtoHashTable
# First thing, find aspnet_isapi.dll
# If we don't find it, we need to verify is mscorwks or mscorsvr is in the process address space.
if($output["aspnet_isapi"] -ne $null)
{
$hasASPXApplication = $hasManagedCode = $true
}
elseif(($output["mscorsvr"] -ne $null) -or ($output["mscorwks"] -ne $null))
{
$hasManagedCode = $true
$hasASPXApplication = $false
}
write-Host "Finding out what each thread is doing..." -foreground Green -background Black
# This is the kernel of this script.
$threadsWorking = Classify-PowerDbgThreads
write-Host "Done!" -foreground Green -background Black
write-Host "Extracting CPU time for each thread..." -foreground Green -background Black
# Gets User mode time.
Send-PowerDbgCommand "!runaway 1"
$hasCommandSucceeded = Has-PowerDbgCommandSucceeded
if($false -eq $hasCommandSucceeded)
{
throw "This dump has no threads information!"
}
# Parses the output. The results are in arrayFromRUNAWAY
$arrayFromRUNAWAY = Convert-PowerDbgRUNAWAYtoArray
# If all threads matches our time limit, it means the limit is the last element of the array.
# In other words, all threads should be considered.
[System.Int32] $indexLimit = (($arrayFromRUNAWAY.count / 2) - 1)
# This flag indicates if, at least, one thread is running for long time is actually consuming high CPU.
$isThreadDoingWork = $false
$currentThreadNumer = 0
# Gets all threads that have CPU time equal or higher than our threshold.
for([System.Int32] $i = 0; $i -lt ($arrayFromRUNAWAY.count / 2); $i++)
{
# Get the thread number.
[System.Int32] $currentThreadNumber = $arrayFromRUNAWAY[$i, 0]
# Checks if thread CPU time is less than our threshold and if the thread is actually doing work.
if($([System.DateTime] $arrayFromRUNAWAY[$i, 1]) -lt $([System.DateTime] $timeLimit))
{
# The limit is from the beginning of the array until the previous element.
# If $indexLimit is -1 it means there are no threads that match our threshold value.
# In other words, we are using a threshold value that is too high.
$indexLimit = $i - 1;
break
}
# We need to have at least one thread doing work.
# For "doing work" I mean:
# 1- Doing I/O.
# 2- Unknwon symbols.
if(($threadsWorking[$currentThreadNumber] -eq $global:g_unknownSymbol) -or ($threadsWorking[$currentThreadNumber] -eq $global:g_doingIO ))
{
$isThreadDoingWork = $true
}
}
# This flag is true if there are no threads that are running for $timeLimit time or more.
# Using a flag is easier to change the code later and avoid problems if we change $indeLimit by mistake.
$hasNoThreadsMatchingLimit = ($indexLimit -eq -1)
write-Host "Done!" -foreground Green -background Black
# Clear Windbg screen.
Send-PowerDbgCommand ".cls"
write-Host "`n`nSUMMARY`n" -foreground Green -background Black
# No threads that match our threshold or the threads that match our threshold are not doing work.
if($hasNoThreadsMatchingLimit -or ($isThreadDoingWork -eq $false) )
{
write-Host "There are no threads consuming CPU time for $timeLimit or more." -foreground Green -background Black
Send-PowerDbgComment "There are no threads consuming CPU time for $timeLimit or more."
}
else
{
write-Host "The following threads either are or may be consuming high CPU:`n" -foreground Green -background Black
Send-PowerDbgComment "The following threads either are or may be consuming high CPU:"
# Prepare header according to CPU time.
write-Host "Thread Number`tUser Time`t`tActivity" -foreground Green -background Black
# Prepare summary for user and detailed information in Windbg screen.
for([System.Int32] $i = 0; $i -le $indexLimit; $i++)
{
# Get the thread number.
[System.Int32] $currentThreadNumber = $arrayFromRUNAWAY[$i, 0]
# We need to have at least one thread doing work.
# For "doing work" I mean:
# 1- Doing I/O.
# 2- Unknwon symbols.
if($threadsWorking[$currentThreadNumber] -eq $global:g_unknownSymbol)
{
# Prepare DML using SOS commands if necessary.
if($hasManagedCode)
{
Send-PowerDbgDML "Thread $currentThreadNumber is doing unknown work and may be running managed code" "~$currentThreadNumber s;kpn 1000;!clrstack;!dso"
}
else
{
Send-PowerDbgDML "Thread $currentThreadNumber is doing unknown work running native code" "~$currentThreadNumber kM 1000"
}
write-Host " " $currentThreadNumber "`t`t" $arrayFromRUNAWAY[$i, 1] "`t`t" $global:g_whatThreadIsDoing[$threadsWorking[$currentThreadNumber]] -foreground Green -background Black
}
elseif($threadsWorking[$currentThreadNumber] -eq $global:g_doingIO)
{
# Prepare DML using SOS commands if necessary.
if($hasManagedCode)
{
Send-PowerDbgDML "Thread $currentThreadNumber is doing I/O and may be running managed code" "~$currentThreadNumber s;kpn 1000;!clrstack;!dso"
}
else
{
Send-PowerDbgDML "Thread $currentThreadNumber is doing I/O work running native code" "~$currentThreadNumber kM 1000"
}
write-Host " " $currentThreadNumber "`t`t" $arrayFromRUNAWAY[$i, 1] "`t`t" $global:g_whatThreadIsDoing[$threadsWorking[$currentThreadNumber]] -foreground Green -background Black
}
}
# If this is an ASP.NET application the user may want to see the ASP.NET pages to know if they are consuming
# high CPU.
if($hasASPXApplication)
{
Send-PowerDbgDML "ASP.NET pages" "!ASPXPages"
}
# Give the user to browse the modules. After locating a specific module based on a thread call stack, the
# user may want to know more about the module.
Send-PowerDbgDML "Modules" "lmD"
}
# Alert user if process is using more Kernel time than User time.
if($isKernelTimeHigher)
{
write-Host "`nAttention! The application is consuming more Kernel time than User time." -foreground Green -background Black
write-Host "This should not be considered normal for a user mode process!`n" -foreground Green -background Black
}
write-Host "`nFor more technical details see the WinDbg window." -foreground Green -background Black
# Notifies user the script finished the execution.
Send-PowerDbgComment "PowerDbgScriptHighCPU was executed. See the PowerShell window for more information."
How to troubleshoot common high CPU scenarios using scripts:
a) High CPU on a process that is not using managed code: Just run PowerDbgScriptHighCPU.
b) High CPU on an ASP application: Run PowerDbgScriptHighCPU and, after isolating the threads consuming high CPU, use GET_ASP_INFORMATION to see what ASP pages and ASP code the threads consuming high CPU are executing.
c) High CPU on ASP.NET or application using managed code: Run GET_PERFMON if you don’t have Performance Monitor logs to verify if there are factors pushing pressure on the managed heap like: Size of Gen 2 compared to other generations, time spent in GC, exceptions, etc… After that run PowerDbgScriptHighCPU to isolate the threads consuming high CPU. If necessary use PowerDbgScriptSaveModule to extract the modules from the method in the thread consuming high CPU, and then use .NET Reflector to decompile the code.
Have fun!
Comments
Anonymous
December 28, 2007
Wow, is Reflector.NET officially endorsed by Microsoft anyhow? It is a very powerful tool indeed, but I could figure out more "offensive" ways to use it.Anonymous
December 28, 2007
Even though the developer that created .NET Reflector works at Microsoft, I don't know if this tool is considered an official tool. Anyway ILDasm, that has similar features, is an official tool: http://msdn2.microsoft.com/en-us/library/d9kh6s92(VS.71).aspxAnonymous
July 13, 2008
This is great but time consuming with lots of setup. There is an app called IISPeek that does all this for you and will instantly show you what page is being executed, for how long, process id, which app pool, etc... It halped us troubleshoot and fix the offending pages. Just Google it to find it on the net. Best of luckAnonymous
July 13, 2008
I've never heard about this tool. I'll check this out, thanks for the information. :)Anonymous
November 24, 2008
Roberto, did you have a look as IISPEEK - I can't see a review of it anywhere on the net - so it would be nice to have an independant review of it rather than just a few dubious comments spread around the netAnonymous
November 25, 2008
Hi John I've never heard about this software before, but I just accessed its website: http://iispeek.com/index.php It seems to be interesting and useful. The GUI is very beautiful! I have to try it...Anonymous
February 03, 2009
I’m very excited to present the new PowerDbg v5.0! There’s just one change, but it’s a HUGE change thatAnonymous
March 19, 2009
So, here we go again. This is a minor version with a few new cmdlets. These new cmdlets are those thatAnonymous
April 14, 2009
This version has two improvements and some scripts were changed to be compatible with this new version:Anonymous
August 15, 2009
Hello I gonna buy new laptop and was thinking what antivirus program to buy? Thanks!