Query Store: How it works? How to use the new Query Store Catalog Views?
Part 2
/*Fix 2017.03.28: Not Query Store DMVs but Catalog Views. Thanks Kalen Delaney for point it*/
“The SQL Server Query Store feature provides you with insight on query plan choice and performance. It simplifies performance troubleshooting by helping you quickly find performance differences caused by query plan changes. “msdn.
If you want to know, how to enable it, you can find information here: Query Store and Query Store Settings and Limits
If you want to know about how query store works (Part 1) Query Store How It works? How to use it? Part 1
This post is focus in how to use query store Catalog Views.
Catalog Views:
Query store Catalog Views can be divided into 2 groups: Plan Store: it is accountable for capture all information that is related to query compilation or Runtime Stats Store: that one is probably the most frequently updated store. These statistics represent query execution data.
Let’s talk about Plan Store:
1.Sys.Query_Store_Query_Text – It contains the Transact-SQL text and the SQL handle of the query. (https://msdn.microsoft.com/en-us/library/dn818159.aspx)
Query:
[sql] SELECT * FROM sys.query_store_query_text [/sql]
Some important columns from a troubleshooting standpoint ( table 1) :

SQL_HANDLE? Yes, that is true, what you are thinking ( I hope, at least). You could join this column with sql_handle from sys.dm_exec_query_stats.
For example:
[sql]
Use Adventureworks
Go
SELECT * FROM Person.Address WHERE AddressID in (1,2)
SELECT * FROM Person.Address WHERE AddressID in (2,1)
[/sql]
If SQL Server is using the default mode of parametrization, the simple one. We will find in the cache 2 plans for this single ad hoc query:
[sql]
SELECT
s.sql_handle
, s.statement_start_offset
, s.statement_end_offset
,s.creation_time
, s.last_execution_time
, t.text
FROM sys.dm_exec_query_stats s
CROSS APPLY sys.dm_exec_sql_text(s.sql_handle) t
[/sql]
We can check the result at figure 1:

Figure 1: Query stats ad hoc
If we join sys.dm_exec_query_stats with sys.query_store_query_text:
[sql]
SELECT query_hash
, t.query_sql_text
, t.statement_sql_handle
, qs.total_logical_reads
, qs.total_logical_writes
, qs.execution_count
, (qs.total_logical_reads/qs.execution_count ) avg_logical
FROM sys.query_store_query_text t
JOIN sys.dm_exec_query_stats qs
ON t.statement_sql_handle = qs.statement_sql_handle;
[/sql]
We can check the result at figure 2:
Figure 2 Query Store and Query Stats execution.
Note: Query Hash information, it is also known as fingerprint of the query. The figure 1 example shows 2 execution plans with different handles and the same fingerprint or query hash. “SQL Server database engine has a powerful new feature that generates an identifier for each query. The identifier is independent of any inline parameter values, so it serves as a very effective query identifier. This identifier – sometimes called a “query fingerprint” – enables a fairly robust method of identifying the most expensive queries on your server based on nothing but DMV queries. “ (https://blogs.msdn.microsoft.com/bartd/2008/09/03/query-fingerprints-and-plan-fingerprints-the-best-sql-2008-feature-that-youve-never-heard-of/) . Summarizing, that is a powerful way to discovery if your environment has a lot of ad hocs query with different execution plans, but they are in matter of fact the same query.
If we look for this information at the Query Store report TOP Resource Consumption queries, it is possible to notice 2 different plans for the same query.
What is expected since we are using simple parametrization (figure 3 and 4):
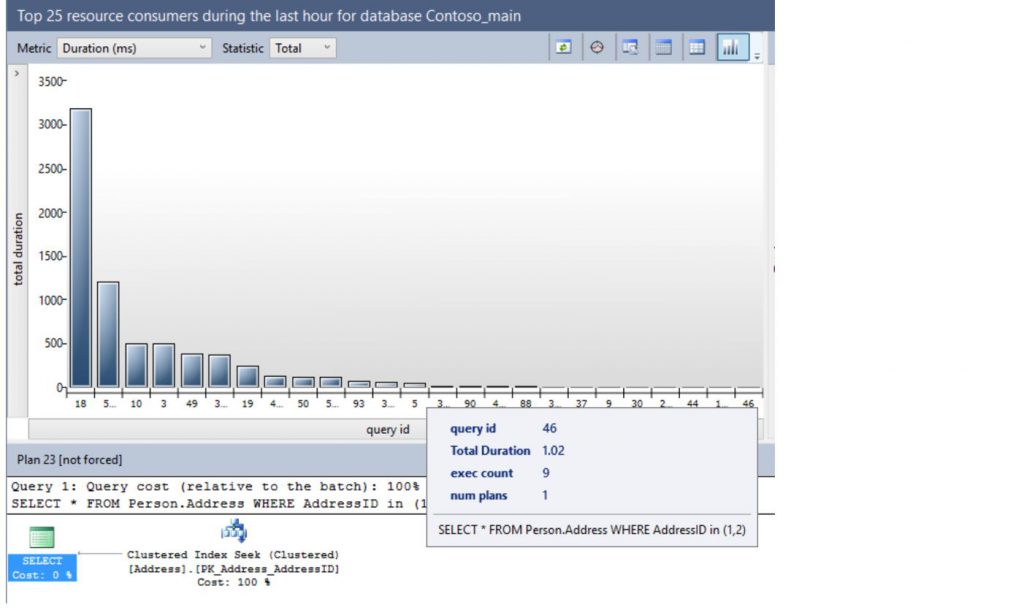
Figure 3 Histogram
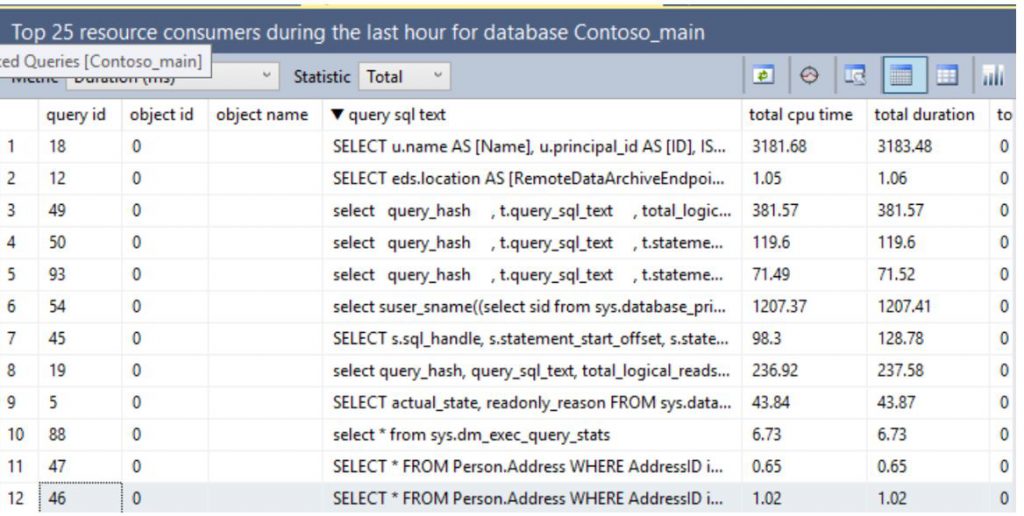
Figure 4 Histogram Queries
Ok. Let’s add more information in this query.
2. Sys.Query_Store_Query – It contains information about the query and its associated overall aggregated runtime execution statistics. ( https://msdn.microsoft.com/en-us/library/dn818156.aspx )
Query:
[sql] SELECT * FROM sys.query_store_query [/sql]
Some important columns from a troubleshooting standpoint (table 2):
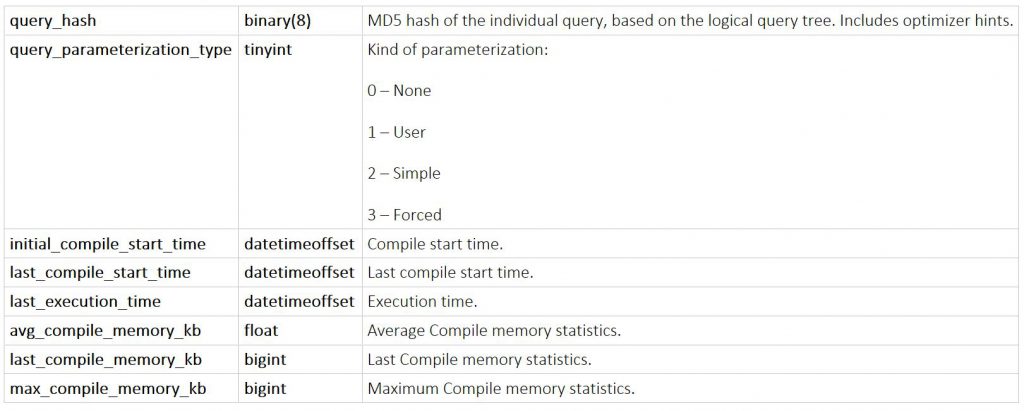
Query:
[sql]
SELECT qq.query_hash
, qq.initial_compile_start_time
, qq.last_compile_start_time
, qq.last_execution_time
, qq.avg_compile_memory_kb
, qq.last_compile_memory_kb
, qq.max_compile_memory_kb
, t.query_sql_text
, t.statement_sql_handle
, qq.query_parameterization_type
, qs.total_logical_reads
, qs.total_logical_writes
, qs.execution_count
, (qs.total_logical_reads/qs.execution_count ) avg_logical
FROM sys.query_store_query_text t
JOIN sys.query_store_query qq
ON t.query_text_id = qq.query_text_id
JOIN sys.dm_exec_query_stats qs
ON t.statement_sql_handle = qs.statement_sql_handle;
[/sql]
The result will be something like the figure 5 and 6:

Figure 5: Query Partial Result 1

Figure 6: Query Partial Result 2
So now, I have more information for troubleshooting. I can easily find the last time the T-SQL statement that I am troubleshooting was compiled (or recompiled, note different values for initial compile and last compile). I can also find how much of memory it was consumed from the query compilation perspective.
And again, in terms of an environment with lot of ad hocs, now I have the fingerprint of my query (Query_hash) stored in Query Store. As this information is in the Query Store catalog view, so it survives a crash.
Ok, so once more let’s try to add more information in this query.
3. Sys.Query_Store_Plan – it contains information about each execution plan associated with a query. ( https://msdn.microsoft.com/en-us/library/dn818155.aspx_
Query:
[sql] SELECT * FROM sys.query_store_plan [/sql]
Some important columns from a troubleshooting standpoint (table 3):

So, there are a lot of interesting columns in this Catalog View as you probably noticed. To properly explain about it, let’s work with some possible scenarios:
Scenarios:
1. Scenario 1: You migrated from SQL Server 2012 to SQL Server 2016. You are aware of a change in the Cardinality Estimator between SQL Server 2012 and 2014 (and later versions). Now, that you are using SQL Server 2016 you want to check the execution plan in 2012 and 2016 for a query.
This scenario has a query that presents a different estimate number for rows in the same database, but with a different compatibility level (Example extract from the Microsoft white paper: Optimizing Your Query Plans with the SQL Server 2014 Cardinality Estimator)
[sql]
ALTER DATABASE CONTOSO_MAIN SET COMPATIBILITY_LEVEL = 110
GO
SELECT[AddressID],
[AddressLine1],
[AddressLine2]
FROM Person.[Address]
WHERE [StateProvinceID] = 9 AND
[City] = N'Burbank' AND
[PostalCode] = N'91502'
ALTER DATABASE CONTOSO_MAIN SET COMPATIBILITY_LEVEL = 130
GO
SELECT[AddressID],
[AddressLine1],
[AddressLine2]
FROM Person.[Address]
WHERE [StateProvinceID] = 9 AND
[City] = N'Burbank' AND
[PostalCode] = N'91502'
OPTION (RECOMPILE)
[/sql]
Note: The Recompile option to regenerate the execution plan for the second query.
Capture Mode Query Store settings should be: All (https://blogs.technet.microsoft.com/dataplatform/2016/10/25/query-store-settings-and-limits/)
Figure 7 will show the query result, you may noticed the same query with 2 different compatibility level ( 130, 110), and figure 8 and 9 you can check the same information in the Query Store reports ( Top Resource Consumption).

Figure 7: Compatibility level result
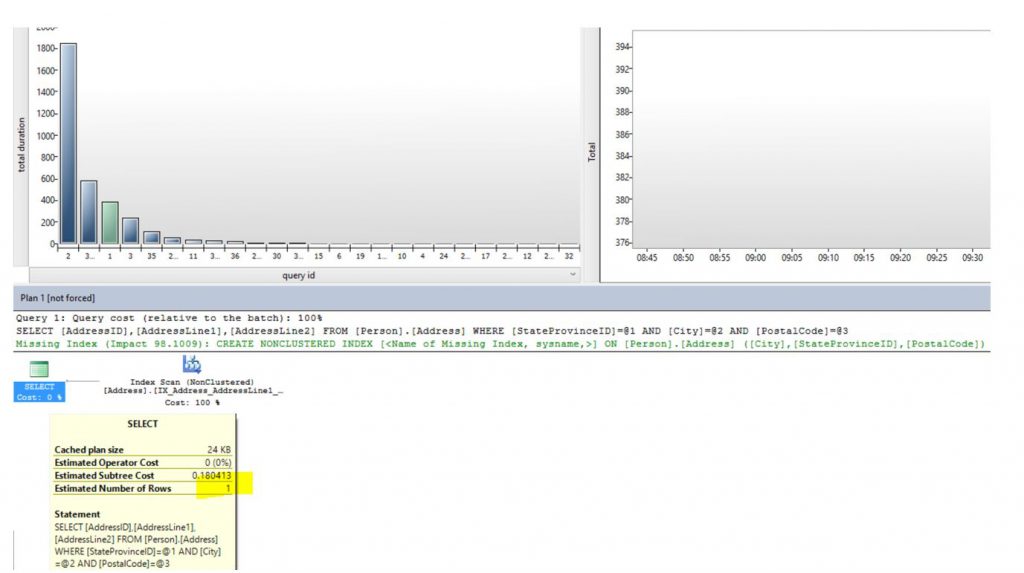
Figure 8: Compatibility level - Query Store Report 1
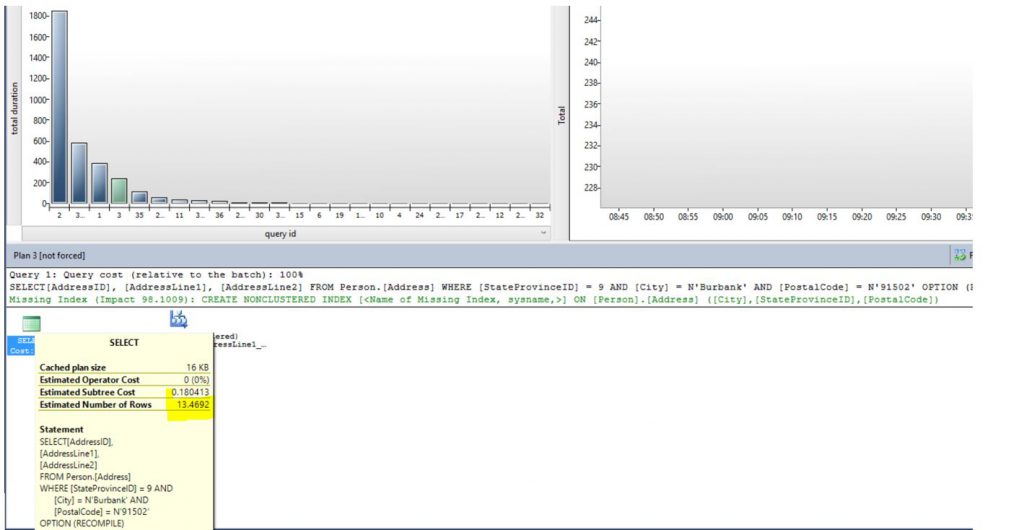
Figure 9: Compatibility level Query 2
You may notice the both queries have different estimated number of rows, as expected. That is because the way that SQL Server estimates the number of rows change in SQL Server 2014. For more information about the new CE: ( https://msdn.microsoft.com/en-us/library/dn673537.aspx )
Query:
[sql]
SELECT qq.query_hash
, qq.initial_compile_start_time
, qq.last_compile_start_time
, qq.last_execution_time
, qq.avg_compile_memory_kb
, qq.last_compile_memory_kb
, qq.max_compile_memory_kb
, qp.compatibility_level
, cast (qp.query_plan as XML) query_plan
, t.query_sql_text
, t.statement_sql_handle
, qp.Query_id
FROM sys.query_store_query_text t
JOIN sys.query_store_query qq
ON t.query_text_id = qq.query_text_id
JOIN sys.query_store_plan qp
ON qp.query_id = qq.query_id
ORDER BY QQ.last_compile_start_time DESC
[/sql]
2.Scenario 2: You saw a lot of waits for CXPACKET in your environment and you want to quickly check how many parallel and trivial queries you have.
Note:
Parallel: SQL Server provides parallel queries to optimize query execution and index operations for computers that have more than one microprocessor (CPU). (https://technet.microsoft.com/en-us/library/ms178065(v=sql.105).aspx )
Trivial: When the plan is a "trivial plan." A trivial plan results when the query optimizer determines that given the tables referenced in the query and the indexes existing on them, only one plan is always optimal. (https://msdn.microsoft.com/en-us/library/ee343986(sql.100).aspx )
Query:
[sql]
SELECT
qq.query_hash
, qp.is_trivial_plan
, qp.is_parallel_plan
, qp.compatibility_level
, cast (qp.query_plan as XML) query_plan
, t.query_sql_text
,COUNT(*)
FROM sys.query_store_query_text t
JOIN sys.query_store_query qq
ON t.query_text_id = qq.query_text_id
JOIN sys.query_store_plan qp
ON qp.query_id = qq.query_id
GROUP BY qq.query_hash
, qp.is_trivial_plan
, qp.is_parallel_plan
, qp.compatibility_level
, query_plan
, t.query_sql_text
[/sql]
3. Scenario 3: You are using SQL Server 2016. You follow the steps in this post (https://blogs.technet.microsoft.com/dataplatform/2017/01/31/query-store-how-it-works-how-to-use-it/) to force a plan. For some unknow reason the force plan failed, you want to troubleshoot that.
Query:
[sql]
SELECT
qq.query_hash
,qp.last_force_failure_reason
,qp.last_force_failure_reason
,cast (qp.query_plan as XML) query_plan
,t.query_sql_text
FROM sys.query_store_query_text t
JOIN sys.query_store_query qq
ON t.query_text_id = qq.query_text_id
JOIN sys.query_store_plan qp
ON qp.query_id = qq.query_id
WHERE qp.force_failure_count >0
[/sql]
4. Scenario 4: You have native compile stored procedure and you want a column that you could quickly check if the procedure is natively compile or not.
- Note: For Query Store track native compile stored procedure you need to enable it: use the procedure to enable [sys].[sp_xtp_control_query_exec_stats]
- ( https://msdn.microsoft.com/en-us/library/dn435917.aspx )
Query:
[sql]
SELECT
qq.query_hash
,qp.last_force_failure_reason
,qp.last_force_failure_reason
,cast (qp.query_plan as XML) query_plan
,t.query_sql_text
FROM sys.query_store_query_text t
JOIN sys.query_store_query qq
ON t.query_text_id = qq.query_text_id
JOIN sys.query_store_plan qp
ON qp.query_id = qq.query_id
WHERE qp.is_natively_compiled = 1
[/sql]
Another relevant information related to Query Store Catalog Views is they are normalized. A change in a Set of options ( for example, Set Ansi Null on or off). it will influence a creation of a new execution plan.
4. sys.query_context_settings: It contains information about the semantics affecting context settings associated with a query. There are a number of context settings available in SQL Server that influence the query semantics (defining the correct result of the query). The same query text compiled under different settings may produce different results (depending on the underlying data).
Query:
[sql] SELECT * FROM sys.query_context_settings [/sql]
You can check the set context options using the column set_options ( table 4).

And now, some information about Runtime Stats Store
1.sys.query_store_runtime_stats: It contains information about the runtime execution statistics information for the query. (https://msdn.microsoft.com/en-us/library/dn818147.aspx )
Query:
[sql] SELECT * FROM sys.query_store_runtime_stats [/sql]
Some important columns from a troubleshooting standpoint (table 5):
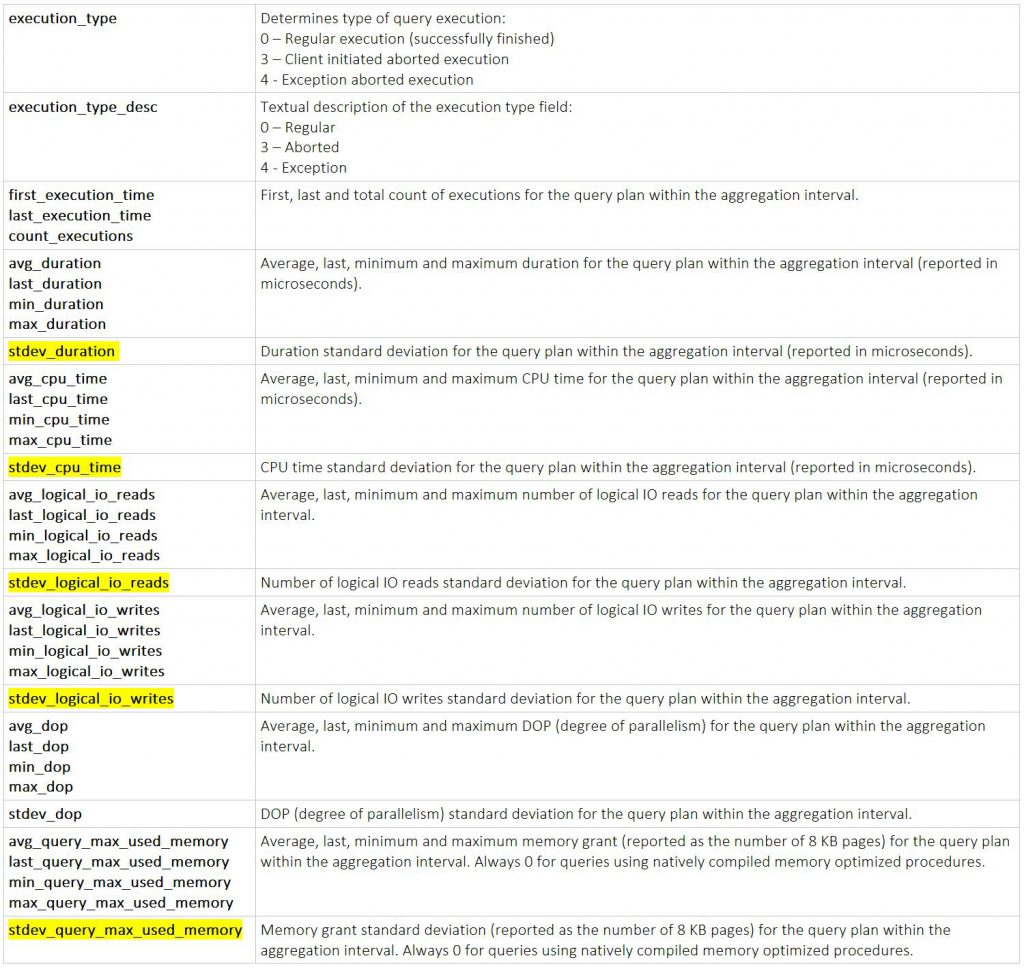
So, basically the stats information for the execution plan is stored in this Catalog View. Note a new information that was not available in other versions, standard deviation. Another interesting column for troubleshooting perspective is execution type column. Suppose you want to be able to track: query abortion, timeout errors... Now, you can:
Query:
[sql]
SELECT
qq.query_hash
,qrt.execution_type
,qrt.execution_type_desc
,cast (qp.query_plan as XML) query_plan
,t.query_sql_text
FROM sys.query_store_query_text t
JOIN sys.query_store_query qq
ON t.query_text_id = qq.query_text_id
JOIN sys.query_store_plan qp
ON qp.query_id = qq.query_id
JOIN sys.query_store_runtime_stats qrt
ON qrt.plan_id = qp.plan_id
WHERE execution_type ! = 0
[/sql]
I simulate a deadlock situation in the Adventureworks database, and the result you can check at figure 10:

Figure 10: Deadlock error tracked
Another Catalog View for this store is the sys.query_store_runtime_stats.
2. sys.query_store_runtime_stats_interval: it contains information about the start and end time of each interval over which runtime execution statistics information for a query has been collected. (https://msdn.microsoft.com/en-us/library/dn818158.aspx )
Query:
[sql] SELECT * FROM sys.query_store_runtime_stats_interval [/sql]
And that is it! A summary of the new query store Catalog Views and how to use.
Liliam Leme
UK SQL PFE
Comments
- Anonymous
March 27, 2017
These objects are NOT DMVs... they are catalog views. There is a big difference.- Anonymous
April 02, 2017
Thanks Kalen - the post has been updated.
- Anonymous
- Anonymous
December 28, 2017
Hello Kalen, Is there any correlation between queryid from query_store and query_hash from dmv sys.dm_exec_query_stats? What about plan id and query_plan_hash?Regards