The Case of the Phantom Hard Page Faults
I am teaching this week, so I figured I would talk about a case I had a few months ago. I have *plenty* of war stories to share, so I can certainly keep this weekly blog going for a long time. ;-)
I’m a big fan of Mark Russinovich and David Solomon, so you may have noticed that I title my blog entries similar to Mark Russinovich’s blog. Mark’s blog (https://blogs.technet.com/markrussinovich/) is full of great information that I use everyday to troubleshoot customer issues. In my case, I am blogging about the customer issues that I encounter each week.
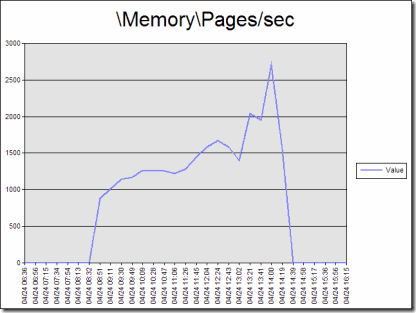
A few months back, I was taking a look at a performance monitor log of a web server. My PAL tool (https://pal.codeplex.com) alerted me that “\Memory\Pages/sec” is breaking it’s threshold (established by our Vital Signs workshop) of more than 2500 pages per second on average. We consider sustained pages/sec of more than 500 to be a Warning and pages/sec of more than 2500 to be Critical.
As you can see here, the pages/sec counter is very high for a long period of time. This *has* to mean that the server is running out of RAM right?
To confirm that theory, I took a look at Available MBytes (the amount of free physical RAM) expecting to see it to be below 5% of total physical memory.
To my surprise, it is always above 1GB free, so why are we seeing such a high number of pages/sec?
I sent an email to my fellow Microsoft colleagues and one of them told me that it is likely caused by memory mapped files.
Here is the definition of Pages/sec according to performance monitor: Pages/sec is the rate at which pages are read from or written to disk to resolve hard page faults. This counter is a primary indicator of the kinds of faults that cause system-wide delays. It is the sum of Memory\Pages Input/sec and Memory\Pages Output/sec. It is counted in numbers of pages, so it can be compared to other counts of pages, such as Memory\Page Faults/sec, without conversion. It includes pages retrieved to satisfy faults in the file system cache (usually requested by applications) non-cached mapped memory files.
According to Wikipedia, memory-mapped files are a segment of virtual memory which has been assigned a direct byte-for-byte correlation with some portion of a file or file-like resource. This resource is typically a file that is physically present on-disk, but can also be a device, shared memory object, or other resource that the operating system can reference through a file descriptor.
In other words, applications like Microsoft Word and Microsoft PowerPoint will not load entire documents into RAM. Instead, they memory map the file, so that when you navigate through the document, it loads portions of the document as needed. The act of loading portions of the document from disk to RAM as a memory mapped file causes a hard page fault which is counted in the pages/sec counter.
When I spoke to the customer about this, they immediately realized that their backup software was running when we observed the high amount of pages/sec. The backup software must have been doing memory mapped files as it went.
Solution: The system was not out of RAM memory when the pages/sec counter was high. It was high because the backup software read in files as memory mapped files which are counted as hard page faults.
Per David Solomon (co-author of the Windows Internals book series), If you want to know for sure if your computer is doing hard page faults due to memory mapped files or to the page file, then run Process Monitor (https://live.sysinternals.com/procmon.exe) with “Enable Advanced Output” checked.
When using Process Monitor filter it to only track disk I/O when pages/sec is high and with “Enable Advanced Output” checked. When done capturing, click Tools, File Summary. If the majority of the disk I/O is to the pagefile.sys, then you might have a low memory issue. Otherwise, go to Tools, Process Activity Summary, to see which process is the most active disk I/O consumer and that process is likely the one doing the memory mapped files.
I learned this by watching his web cast at the following address. This is one of the *best* presentations I have ever seen on how memory really is handled.
David Solomon – Understanding and Troubleshooting Memory Problems
https://www.microsoft.com/emea/spotlight/sessionh.aspx?videoid=64
Comments
Anonymous
January 01, 2003
Very good post. Thanks for sharing.Anonymous
July 17, 2009
The comment has been removedAnonymous
August 23, 2009
I don't think that Process Monitor supports gathering data when a condition is met. You would have to create a trigger to do this with a Perfmon Alert or Microsoft System Center. In addition, the data is gathered very quickly and would be hard to manage. The easiest solution would be to put a filter on just the pagefile.sys file itself and measure it for awhile. I wouldn't run Process Monitor very long though due to the large amount of data it gathers.Anonymous
January 02, 2010
Clint, this is an excellent explanation & characterization of memory mapped files in the real-world. Thanks.Anonymous
February 23, 2011
i can't find the video any longer. you have a new link perhaps? googling all came up with links that don't work anymoreAnonymous
December 13, 2013
Very nice article... I have a small query regarding the below mentioned comment -: "If you want to know for sure if your computer is doing hard page faults due to memory mapped files or to the page file" Can't we check the PF Usage in PerfMon to find out if the faults are due to memory mapped files or Page file rather than using ProcMon ?Anonymous
October 07, 2014
The comment has been removed

