Multi Column GroupBy Aggregate using R in Azure ML studio
Azure ML Studio is ...... Well if you don't know what it is then you better go here and get some basics. Its the most ultimate experience in my knowledge that orchestrates the machine learning process's each level very intuitively.
Quite recently I was working on some data which required GroupBy aggregation at different column levels. Consider the data in this format
| RegionCode | RegionName | StoreCode | Category | ProductCode | ProductName | Quantity | Size | Gender | Season | PricePointName | ProductCategoryName |
| 3 | Michigan | 499 | SHOES | 487369 | KWANGO | 1 | 6 | Men | FW 09 | FTW < 10000 | FOOTWEAR |
| 3 | Michigan | 499 | TOPS | 498510 | ADIPURE BRA | 1 | L | Women | SS 14 | FTW 6000-6999 | APPAREL |
| 3 | Michigan | 499 | SANDALS/SLIPPERS | 499408 | ADI SUN | 1 | 8 | Men | FW 15 | FTW 1000-1999 | FOOTWEAR |
| 3 | Michigan | 500 | SANDALS/SLIPPERS | 499429 | ADI SUN | 2 | 8 | Men | FW 15 | APP 2000-2499 | FOOTWEAR |
| 3 | Michigan | 500 | SHOES | 500228 | DURAMO 6 LEA M | 1 | 11 | Men | SS 15 | FTW 6000-6999 | FOOTWEAR |
| 3 | Michigan | 500 | SHOES | 500284 | HOWZAT J V | 1 | 3 | Kids-Boys | FW 14 | FTW 3000-3999 | FOOTWEAR |
| 3 | Michigan | 500 | PANTS | 541832 | ESS 3S KN PANT | 3 | M | Women | SS 14 | APP 1500-1999 | APPAREL |
| 3 | Michigan | 499 | PANTS | 544313 | NEW FIREBIRD TP | 1 | 34 | Women | SS 15 | APP 1500-1999 | APPAREL |
| 3 | Michigan | 499 | PANTS | 544314 | NEW FIREBIRD TP | 2 | 40 | Women | SS 15 | APP 2500-2999 | APPAREL |
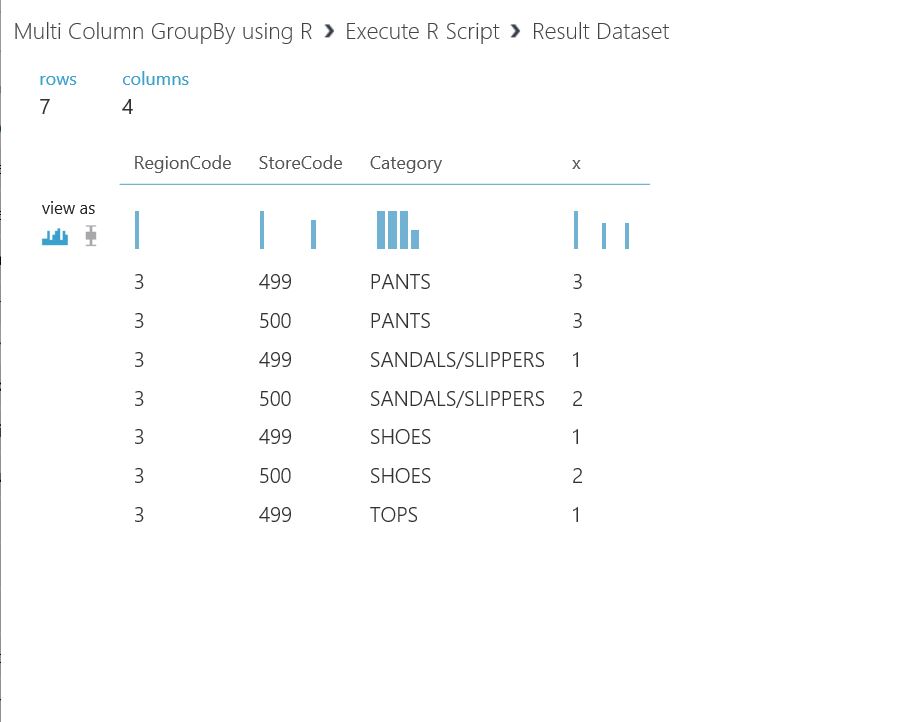
I wanted to get a group by aggregate SUM on Quantity group by multiple columns like RegionCode, StoreCode, and Category. It would only take a line of code using R, Just drag and drop the Execute R Script component and write this simple statement
# Map 1-based optional input ports to variables
dataset1 <- maml.mapInputPort(1) # class: data.frame
data.set = aggregate(dataset1$Quantity, by=list(RegionCode=dataset1$RegionCode,StoreCode=dataset1$StoreCode,Category=dataset1$Category), FUN=sum)# Select data.frame to be sent to the output Dataset port
maml.mapOutputPort("data.set");
Run the experiment, right click the "Execute R Script" component and click on "Result Dataset --> visualize"
[caption id="attachment_166" align="aligncenter" width="919"] Visualize Data[/caption]