Transact-SQL Debugger for SQL Server 2008 – Part 1
In my next series of blog posts, I’ll explore the Transact-SQL Debugger for SQL Server 2008. This feature only works against database instances of SQL Server 2008. If you need to use a debugger for SQL Server 2005, you’ll have to use the Visual Studio Professional SKU or better. Please refer to the MSDN topic on How to: Enable SQL Server 2005 Debugging.
This series will cover:
- Basic debugging
- Configure remote debugging & best practices
- Debugging triggers and stored procedures with breakpoints
The Transact-SQL debugger in SQL Server Management Studio enables you to find errors in Transact-SQL scripts, stored procedures, triggers, and functions by observing their run-time behavior. You can start the debugger when you are using the Database Engine Query Editor window. By using the Transact-SQL debugger, you can do the following:
- Step through the Transact-SQL statements in the editor line by line, or set breakpoints to stop at specific lines.
- Step into or over Transact-SQL stored procedures, functions, or triggers that are run by the code in the editor window.
- Watch the values that are assigned to variables, and observe system objects such as the call stack and threads.
The examples that I’m going to show are based on the SQL Server 2005 version of AdventureWorks that can be downloaded here. My demo for this post assumes that SSMS in debugging and instance on the same machine. I’ll cover remote debugging in Part 2. If you need to deal with remote debugging and can’t wait – check out the help topic on Configuring and Starting the Transact-SQL Debugger.
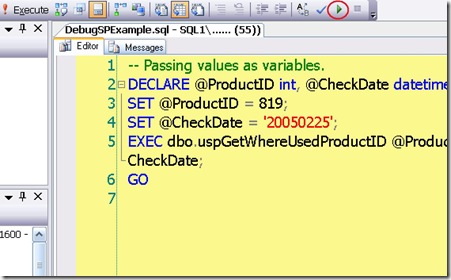
To kick things off, open the script file that you want to debug and then click on the green debug toolbar button or press [ALT]-[F5].
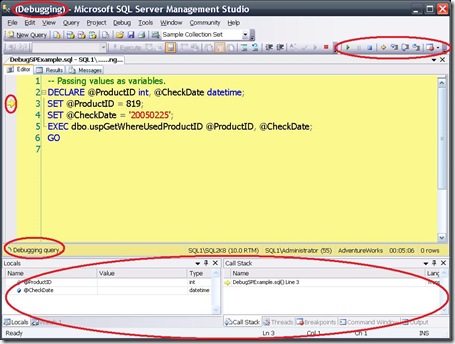
SSMS launches into a Debugging session by clearing aside may of your tool windows, opens the debugger specific tool windows and debugger toolbar, and displays a Yellow arrow indicating the next statement to execute.
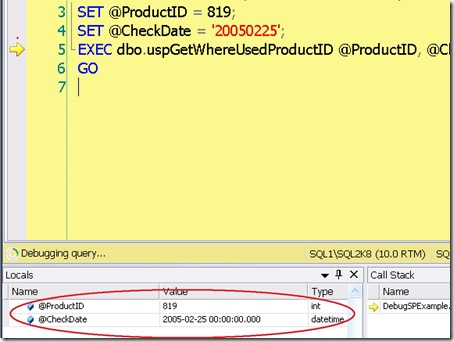
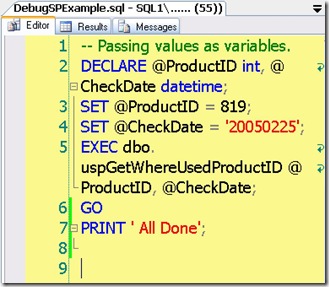
To step through statements like two set statements in this example, press the F11 key twice. You’ll notice that the Locals is now populated with the two variables.
The next F11 action then steps into the stored procedure. If you press the Step-Over [F10], you would go right over the stored procedure and in this case – end the debugging session.
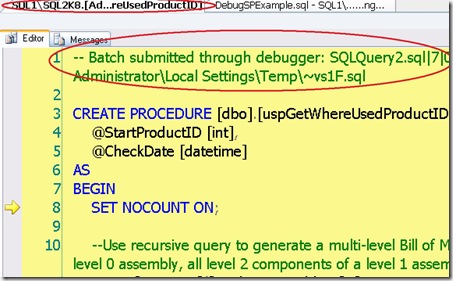
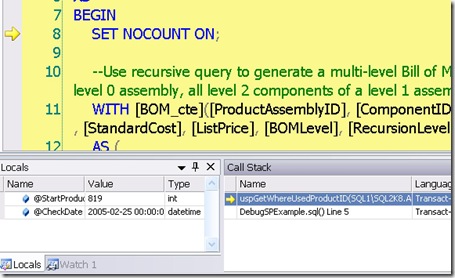
The debugger opens a special editor window for the stored procedure that you just stepped into along with hints that you don’t really want to make edits to this file.
The other thing you’ll notice is the Locals window now shows the value for the SP parameters and the Call Stack window is updated to show that you are now in the SP.
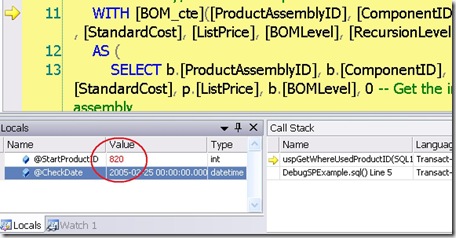
The Locals window allows you to edit values so that you can change scenarios inside of the debug session. You can use the mouse or the [CTRL]+[ALT]+[V], [L] command to navigate to the Locals window. This is a little different pattern of calling up debugger windows like [CTRL]+[ALT]+[C] for the Call Stack window because [CTRL]+[ALT]+[L] was already taken for displaying the Solution Explorer. Back to the task – now double click on the value 819 for @StartProductId and then type in 820 and press [ENTER]. You’ll see that the value changes color to Red meaning it’s been modified.
We could continue to step thru the procedure, but since this procedure only has one more command, we can press the Step Out [SHIFT]+[F11] command to complete execution in the stored procedure.
If you had additional statements in the original script DebugSPExample.sql script like this:
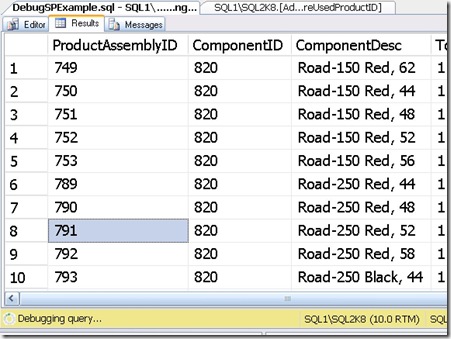
The debugger would set focus to the editor window and indicate in the status bar “Debugging query” to remind you that you are still debugging.
If you press [ALT]+[F5], you would complete the debugging session for this demo.
Here are the keystrokes for the debugger with the Standard keyboard setting.
Action |
Standard |
Start or continue debugging |
ALT+F5 |
Stop debugging |
SHIFT+F5 |
Step into |
F11 |
Step over |
F10 |
Step out |
SHIFT+F11 |
Implement the Run To Cursor command |
CTRL+F10 |
Display the QuickWatch dialog box |
CTRL+ALT+Q |
Toggle breakpoint |
F9 |
Delete all breakpoints |
CTRL+SHIFT+F9 |
Display the Breakpoints window |
CTRL+ALT+B |
Break all |
CTRL+ALT+BREAK |
Display the Watch 1 window |
CTRL+ALT+W, 1 |
Display the Watch 2 window |
CTRL+ALT+W, 2 |
Display the Watch 3 window |
CTRL+ALT+W, 3 |
Display the Watch 4 window |
CTRL+ALT+W, 4 |
Display the Autos window |
CTRL+ALT+V, A |
Display the Locals window |
CTRL+ALT+V, L |
Display the Immediate window |
CTRL+ALT+I |
Display the Call Stack window |
CTRL+ALT+C |
Display the Threads window |
CTRL+ALT+H |
That’s it for debugging basics for part 1.
Technorati Tags: SQL Server Management Studio,Transact-SQL Debugger,SQL Server 2008
Comments
- Anonymous
April 11, 2009
PingBack from http://asp-net-hosting.simplynetdev.com/transact-sql-debugger-for-sql-server-2008-%e2%80%93-part-1/ - Anonymous
April 11, 2009
This blog will go over what you need to know for setting up your environment for remote debugging along - Anonymous
April 12, 2009
Thank you for submitting this cool story - Trackback from DotNetShoutout - Anonymous
April 12, 2009
In part 3 of working with the debugger, I’ll talk about how to set breakpoints and the trick to setting - Anonymous
April 15, 2009
Bill Ramos, a SQL Server Product Manager, has written a three part series on how to use the SQL Server - Anonymous
May 15, 2009
One of the attendees of my TechEd session “DAT315 - Manageability Series: Uncover Hidden Secrets of T-SQL - Anonymous
July 14, 2011
I found some issues in working with TSQL debugger.If you have some changes in the Stored procedure,the user makes changes and then starts debugging again.The newly made changes are not getting reflected in the debugging window.The user has to stop the debugging,recompile teh stored procedure and then debug.Otherwise the changes are not getting reflected. - Anonymous
June 06, 2012
Easy steps have been explained in helpprogramming.blogspot.com/.../debugging-sql-stored-procedure.html.I found it very helpful. - Anonymous
October 27, 2014
nicely explained ... old but useful.. thanks
