Server Activity History Report–MDW Report Series Part 4
By Bill Ramos, Program Manager, SQL Server Manageability Team
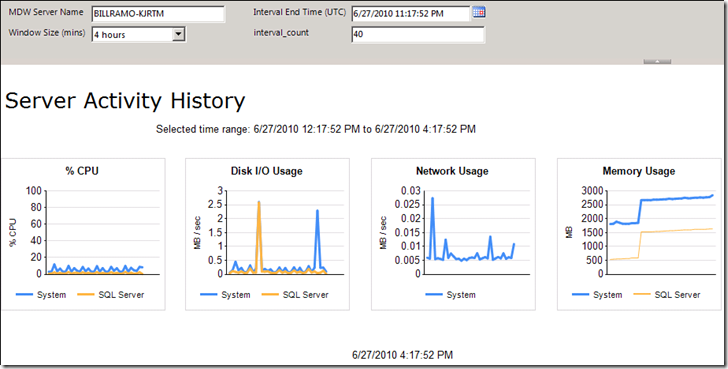
In part 3 of the report series, I showed how to get CPU data from the MDW and display it as a thumbnail chart in the Server Activity History report. In part 4, I’ll show how to extract data from the MDW for the Disk I/O Usage, Network Usage, and Memory Usage thumbnail charts rounding out the top of the report as sown below.
For the DBA new to Reporting Services, I’ll also show how to make sure that the color for System and SQL Server series is the same across the thumbnail charts – something that the shipping reports don’t do. ![]() I’ll also point out some other tricks like changing the thickness of the lines in the charts – seemed like it should be simple – but took me an hour to figure that one out.
I’ll also point out some other tricks like changing the thickness of the lines in the charts – seemed like it should be simple – but took me an hour to figure that one out. ![]()
Disk I/O Usage Thumbnail
The Disk I/O Usage chart gets its data from the Process performance counter object and has four conversion records in the core.performance_counter_report_group_items table that I described in part 3. The System series reports the _Total for the sum of the IO Read Bytes/sec and IO Write Bytes/sec performance counters. The SQL Server series reports the sum of the same two counters for the specific instances. You can use the following query to see what counters are used.
USE sysutility_mdw -- Use your MDW name here
GO
SELECT counter_subgroup_id, series_name, object_name, object_name_wildcards,
counter_name, instance_name, multiply_by
FROM    core.performance_counter_report_group_items

WHERE   (counter_subgroup_id = N'IOUsage');
When you run the query, you’ll notice that the multiply value is 0.0000009537. This value is used to convert bytes/sec to MB/sec ( = bytes / 1024 / 1024).
From a reporting standpoint, we can reuse the Perfmon Dataset used for the CPU chart by just changing the filter expression for the chart.
Tweaking the CPU Chart Before Copy/Paste
The easiest way to get going with the Disk I/O Usage chart is to copy the CPU chart and paste it back into the report. Before doing the copy/paste action, there are two little changes you’ll want to make.
- Getting the series colors to be consistent for the charts. Reporting Services uses color palettes to determine which color to display for the discrete series values in the chart. For the this report, I’m using the BrightPastel palette. You can also create custom palettes by following the MSDN topic: How to: Define Colors on a Chart Using a Palette. The trick is knowing that the Reporting Services uses the first color in the palette for the first series, the second color for the second series, and so on, based on the order of the series values in the group. If we jump ahead to the Network Usage chart, you’ll see that there is only one series group value = “System”. The other charts have both “System” and “SQL Server”. By default, the chart displays the series groups in ascending order. This means, you would normally see “SQL Server” before “System”. What ends up happening is, Network chart, “System” shows up as Blue, but since it’s the second value in the other charts, it shows up as Gold. To correct this problem, do the following:
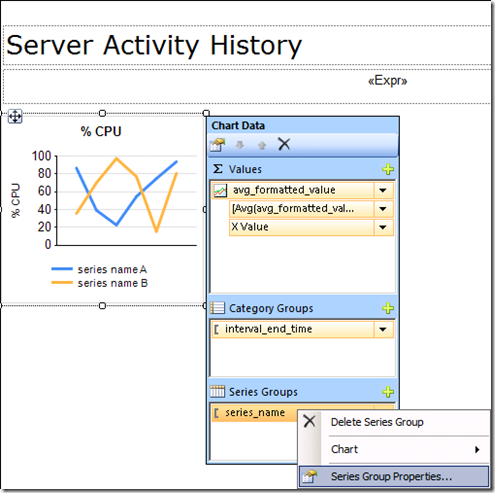
- Click the CPU chart to display the Chart Data on the lines in the CPU chart that represents the series.
- Choose the Series Properties command as shown below
-
- Go to the Sorting page and click Add.
- Use the Sort by value of [series_name] and the order of Z to A.
- Click OK. The thumbnail charts will now show System before SQL Server giving a consistent color for the series groups.
- Making the series lines thicker. In a future posting, we are going to add an Action to the series lines to drill into detail reports. to make it easier to click on the line, you’ll want to make the line thicker. To save you the agony of guessing what property value to set, just follow these instructions.
- Right-click on one of the lines in the series graph – inside of the chart area – and choose the Series Properties command.
- Go to the Border page.
- Change the Lined width from 1pt to 2pt.
- Click OK. The lines inside of the chart should now be thicker.
Creating the Disk IO Usage Chart
Just select the CPU chart so that the entire outline of the chart is selected and issue the paste command. Then move to chart along side of the CPU chart. Follow these steps to modify the CPU chart to use the IOUsage data.
Chart Properties
- Right click on the new chart and choose the Chart Properties command.
- On the General page, change the name of the chart to DiskIOChart.
- On the Filters page, change the filter Value from cpuUsage to IOUsage and click OK.
Chart Data Values
- Click in the chart data region to display the Chart Data control
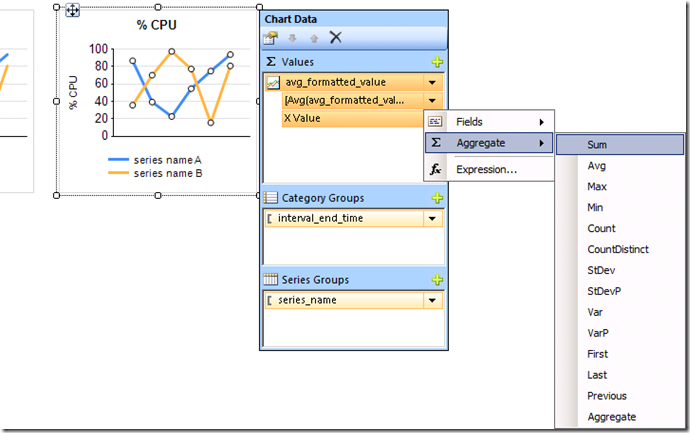
- Change the aggregate function for [avg_formatted_value] from Avg to Sum as shown below. This is so that the you report the sum of IO Read Bytes/sec and IO Write Bytes/sec performance counters for the interval period.
Vertical Axis Properties
The chart needs to show MB/sec so the maximum range for values is no longer 100. To change this axis values, do the following:
- Right-click on the vertical axis numbers and choose the Vertical Axis Properties command.
- On the Axis Options page, change the Maximum value from 100 to be blank. This allows the chart to automatically scale based on the maximum value for the time window.
- Click OK.
Label Text Changes
- Change “%CPU” in the title to “Disk I/O Usage”
- Change “%CPU” on the vertical axis to “MB/sec”
At this point, you can now Run the report to check out your work.
Network Usage Thumbnail
The Network Usage chart is almost like Disk IO. It uses just one counter ( Bytes Total/sec) from the Network Interface counter object. to create the chart, do the following:
- Copy the Disk I/O Usage chart and paste it into the report. Move it just to the right of the existing Disk I/O chart.
- Right click on the chart and choose the Chart Properties command.
- On the General page, change the Name of the chart to NetworkUsageChart.
- On the Filters page, change the filter value from IOUsage to networkUsage.
- Click on the chart area to display the Chart Data control.
- In the Sum Values section, click on the little down arrow for the [sum[avg_formatted_values]] expression (the second one down) and select the Expression command. For the Y Value expression text, enter the following:
=Avg(Fields!avg_formatted_value.Value) / 1024 / 1024
The reason for using the expression is that the record for for networkUsage in the core.performance_counter_report_group_items table has a multiply factor of 1.0 (a compensated bug)
. We originally tested on slow network cards and didn’t realize we needed to report on a scale of MB/sec. Rather than fix the table, the “unnamed” developer put the conversion of bytes to MB in the chart value expression. We have to live with this for now.
- Change the chart title from “Disk I/O Usage” to Network Usage”.
At this point, the Network Usage chart is ready to go.
As you can see, reporting against performance counters is really simply with the help of the Perfmon dataset that uses the snapshots.rpt_generic_perfmon stored procedure in the MDW. The magic having the corresponding records in the core.performance_counter_report_group_items table.
Memory Usage Thumbnail
Data for the memory usage for the System and SQL Server is stored in the snapshots.sql_process_and_system_memory table. This data is collected every minute by the Server Activity collection set from the sys.dm_os_process_memory, sys.dm_os_sys_memory and sys,dm_sys_info DMVs using the following query:
SET NOCOUNT ON
SELECT
pm.physical_memory_in_use_kb AS sql_physical_memory_in_use_kb,
pm.large_page_allocations_kb AS sql_large_page_allocations_kb,
pm.locked_page_allocations_kb AS sql_locked_page_allocations_kb,
pm.total_virtual_address_space_kb AS sql_total_virtual_address_space_kb,
pm.virtual_address_space_reserved_kb AS sql_virtual_address_space_reserved_kb,
pm.virtual_address_space_committed_kb AS sql_virtual_address_space_committed_kb,
pm.virtual_address_space_available_kb AS sql_virtual_address_space_available_kb,
pm.page_fault_count AS sql_page_fault_count,
pm.memory_utilization_percentage AS sql_memory_utilization_percentage,
pm.available_commit_limit_kb AS sql_available_commit_limit_kb,
pm.process_physical_memory_low AS sql_process_physical_memory_low,
pm.process_virtual_memory_low AS sql_process_virtual_memory_low,
sm.total_physical_memory_kb AS system_total_physical_memory_kb,
sm.available_physical_memory_kb AS system_available_physical_memory_kb,
sm.total_page_file_kb AS system_total_page_file_kb,
sm.available_page_file_kb AS system_available_page_file_kb,
sm.system_cache_kb AS system_cache_kb,
sm.kernel_paged_pool_kb AS system_kernel_paged_pool_kb,
sm.kernel_nonpaged_pool_kb AS system_kernel_nonpaged_pool_kb,
sm.system_high_memory_signal_state AS system_high_memory_signal_state,
sm.system_low_memory_signal_state AS system_low_memory_signal_state,
si.bpool_commit_target AS bpool_commit_target,
si.bpool_committed AS bpool_committed,
si.bpool_visible AS bpool_visible
FROM sys.dm_os_process_memory AS pm

CROSS JOIN sys.dm_os_sys_memory AS sm   -- single-row DMV

CROSS JOIN sys.dm_os_sys_info AS si;    -- single-row DMV
To prepare this data for the reports, you can use the snapshots.rpt_sql_process_and_system_memory stored procedure to get the data just like you would for the performance counters.
This stored procedure only takes three parameters:
- ServerName
- EndTime
- WindowSize
Create the SqlProcessAndSystemMemory Dataset
To create the dataset that calls the snapshots.rpt_sql_process_and_system_memory stored procedure, do the following:
- Right click on the Datasets node in the Report Data control and select the Add Dataset command.
- Change the Name field to SqlProcessAndSystemMemory.
- Select the “Uue a dataset embedded in my report” option.
- Select the MDW Data source.
- Choose the Stored Procedure option for Query type.
- Choose the snapshots.rpt_sql_process_and_system_memory for the stored procedure name.
- Click OK for the Dataset Properties.
- Click OK again for the Define Query Parameters dialog.
You now have a dataset ready for the Memory Usage thumbnail chart. You’ll notice that there are 45 fields returned in the dataset – we will only need four fields.
Creating the Memory Usage Chart
This chart is a bit different from the other charts – there is no series group. Instead, it uses two values. Here is what you can do to create the chart:
- Copy the Network Usage chart to the clip board and paste it back into the report. Move it just to the right of the Network Usage chart.
- Right click on the chart and select the Chart Properties command.
- In the General page, change the name of the chart to MemoryUsageChart. Change the Dataset name to SqlProcessAndSystemMemory.
- In the Filters page, click inside of the filter expression and then choose the Delete command. This chart doesn’t use a filter.
- Click OK for the Chart Properties.
- In the Chart Data control for the new chart, right click on the [series_name] group within the Series Group section and choose the Delete Series Group command.
- In the Chart Data control, right click on the avg_formatted_value field in the Sum Values group and choose the Delete Series command.
At this point, you should only have the [interval_end_time] field in the Category Group section for Chart Data.
Adding the Series Values
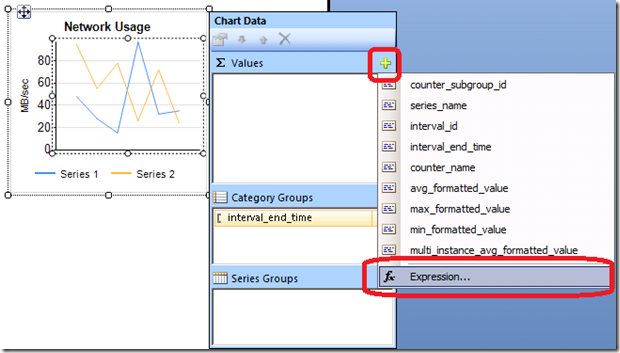
To add the two series value expressions, you need to click on the Plus icon on the caption line as shown below and select the Expression command.
Enter in the following expression for System Memory. This expression computes the memory used by the system as the total physical memory minus the available physical memory averaged over the interval period and divides the result by 1024 to convert the value to MB.
=Avg(Fields!system_total_physical_memory_kb.Value-Fields!avg_system_available_physical_memory_kb.Value) / 1024
To complete the series definition, do the following:
- Right click on the new series and select the Series Properties command.
- On the Legend page, change the Custom legend text to System.
- On the Border page, change the Line width value to 2pt.
- Click OK to for the Series Properties dialog.
Next, we will add the SQL Server Memory used value. This comes directly from the result field named avg_sql_physical_memory_in_use_kb.Value.
- Click on the Plus command for the Sum Values group like you did for the previous group and choose the Expression command.
- Enter in the following expression for the series value.
=Avg(Fields!avg_sql_physical_memory_in_use_kb.Value) / 1024
- Click OK for the Expression dialog.
- Right click on the second series and choose the Series Properties command.
- On the Legend page, change the Custom legend text to SQL Server.
- In the Border page, change the Line width value to 2pt.
- Click OK to for the Series Properties dialog.
Let’s clean up the chart title by replacing Network Usage to Memory Usage. Then change the vertical axis label from MB/sec to just MB.
That’s it for this post. I’ve attached the latest version of Server_Activity_Part4.rdl to as a reference.
In the next post, I’ll go over the SQL Server Waits stats chart, but with improvements to stabilize the colors and use an area chart instead of the stacked bars.
Technorati Tags: Data Collector,SQL Server 2008,SQL Server 2008 R2,SSMS Reports,MDW
Comments
- Anonymous
August 03, 2010
Please provide details for Wait Type report. - Anonymous
August 10, 2010
Hi Bill,I tried emailing you and raising my queries on the blogs, please assists all reporting like standard reports, performance dashboard reports are accessible in the .rdl format but the MDW reports. We need to have an external hosting site for the company to pulish the reports. Please assist in identifying the report set for MDW.YOur Help is highly appreciated.ThanksVikas Dharia - Anonymous
September 29, 2010
This is a very useful series to someone new to SSRS. But Seems like What is need by the product is an ability to install/create the built-in reports to a reporting services database and the ability to augment the the built-in reports in SSMS. Do you know if there is a connect issue on this? - Anonymous
September 30, 2010
Hi Bill,Following up on further availability of reportsThanks


