Visual Studio 2010 + sos.dll: finding memory leaks
During development phase of my current project I try to figure out if my application has memory leaks. The client where I am working prevent me from installing software on my development computer. I don’t have installed Microsoft Windows SDK, so I cannot use WinDBG. This article is a quick post to introduce Visual Studio 2010 and sos.dll
Project configuration
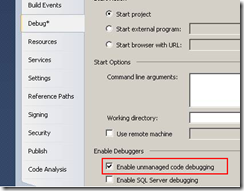
Before starting your application, on the project properties> Debug tab, make sure that “Enable unmanaged code debugging” is enabled.
Starting analyzing
Start your debugging your application, execute the scenario where you found that there is a memory leak, break at the end of this execution (Break All or CTRL+ALT+DEL).
In Visual Studio, Open the immediate windows and load sos.dll.
For .net 4.0 application:
.load C:\windows\Microsoft.NET\Framework\v4.0.30319\sos.dll
or
.load sos
For .net 2.0, 3.0 or 3.5 application:
.load C:\windows\Microsoft.NET\Framework\v2.0.50727\sos.dll
Enter the following command line to get the summary of object types that are still in memory:
!dumpheap –stat
If one of the type should not be in memory, you can filter for a specific type:
!dump –type MyNamespace.MyType
This lists all objects of this specific type in the heap. Once you have the address of one specific object you can get a dump of a specific object:
!gcroot 02369d30
This dump lists all the objects that references, and that forces the object to be kept in the heap. After you should investigate deeper ![]()
Main commands to use
| Command | Comment |
!dumpheap –stat |
Summary of classes |
| MyNamespace.MyType | Lists all objects in the heap of this specific type |
!gcroot 02369d30 |
Returns the ump of a specific object |
Interesting links
MSDN reference : https://msdn.microsoft.com/fr-fr/library/bb190764.aspx
Tess Ferrandez blog: https://blogs.msdn.com/b/tess/ (very interesting blog). She wrote several good post but also one dedicated on “Debugging Silverlight applications with windbg and sos.dll”
