Power BI and Dynamics AX: Part 1: Introduction
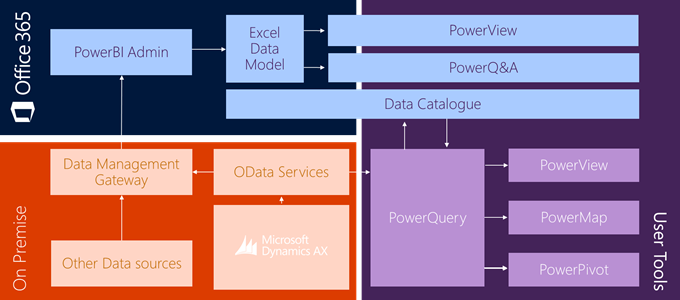
The recent updates to Power BI on Office 365 have opened up a huge amount of potential for leveraging Power BI functionality for analytics on Dynamics AX data. This first post is going to focus on the high level architecture and the various components involved. The next few posts in the series are going to be in more detail around each of the main components involved, the lessons learnt and any tips picked up by the Solution Architecture team. As a heads up, this isn't a step by step detailed manual of how to use PowerBI, instead it will highlight the approach and reference guides where they already exist on TechNet and other Microsoft resources.
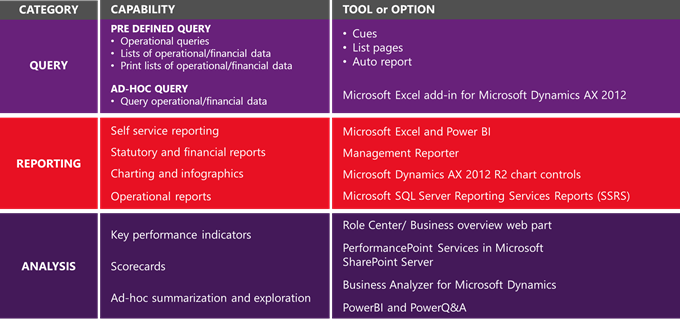
Power BI, like any other business intelligence tool should be used as part of a strategy – Power BI on its own will not be the only tool within your Reporting and Business Intelligence Strategy, and shouldn't be used to replace tools like SSRS (SQL Server Reporting Services), it should be used to complement them. Power BI is a fantastic tool for simple and clear visualisations, and providing tools for users to leverage as Self Service BI. The below is a summary of key tools available for reporting and BI for Dynamics AX, as you can see PowerBI is best placed for self-service reporting, and support of Ad-Hoc exploration of data. Before embarking on the Power BI journey, you should have a clear understanding of what your organisations Reporting and BI Strategy is, and what needs Power BI will meet for you as an organisation.

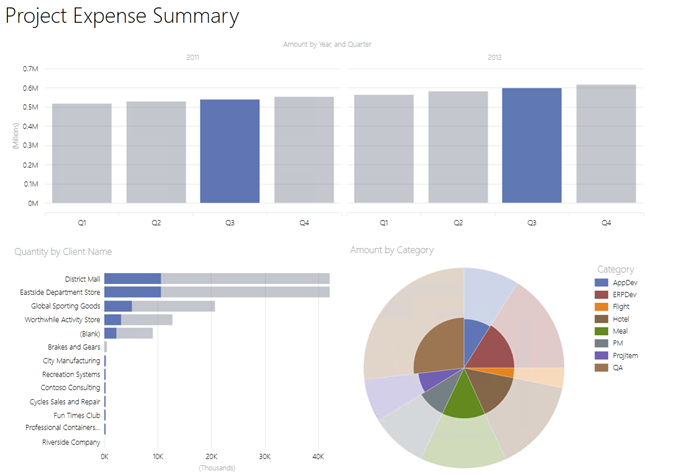
The most powerful part of using Power BI on top of the Dynamics AX data is how quickly you can produce and publish high impact visualisations that can then be accessed through Excel, the web, on a tablet or through the Power BI Windows 8 app. Below is a simple example of a PowerBI report published on PowerBI.

Why should you look at Power BI for you Dynamics AX Business Intelligence?
- PowerView visualisations can be created easily, and in most cases by end users once clear data sources have been defined.
- Dynamics AX data is accessed and refreshable through OData, allowing you to leverage the Dynamics AX Queries already developed.
- PowerQ&A requires a minimal investment of time to start leveraging your data in natural language queries.
- Users can access PowerView reports through HTML 5 allowing them be accessed on most devices.
- Power BI can source data from a huge list of sources, not just Dynamics AX – which means Power BI can become a common tool across all data sources within an organisation, and even pull in external data from sources like the Azure Data Market.
- The Power BI team are continuing to implement new features all the time into the whole stack which users get to leverage through Office 365.
Power BI – The Key Components

Power BI on Office 365 itself has a huge amount of functionality – we are going to focus on PowerQuery, PowerView and Power Q&A.
PowerQuery – PowerQuery is an add-in available for Excel, similar to the Excel Data tab. PowerQuery supports a lot more data sources from SQL, Azure Data Sources, Facebook and for our purposes, OData. PowerQuery is the tool used to query OData sources from Dynamics AX into the PowerQuery Data Model. One of the later posts in this series will cover some of the lessons learnt for organising your AX queries.
PowerView – PowerView is a visualisation tool available within Excel. PowerView allows you to create clean and simple visualisations on data either within your Excel workbook, or from the Excel Data Model.
PowerQ&A – PowerQ&A allows dynamic visualisations and reports to be prepared through Office 365 by natural language questions. PowerQ&A uses the data loaded into the Excel Data Models for workbooks.
There are also a lot of tools in the background supporting these tools and the refresh of the data which will be covered in the later posts.
Getting Started
Below are the key steps in leveraging PowerBI against your Dynamics AX Implementation, the subsequent posts will go into more detail on the below topics, as well as point you in the direction of relevant TechNet articles which will provide a step by step.
- Extracting Data via OData
- Transforming your data
- Creating Visualisations
- Publishing your reports
- Exploring your data
Dynamics Technical Conference 2015 Content
This year's Dynamics Technical Conference had two sessions related to Power BI, and the content is now available online for download. You can access all of the content from the Conference on CustomerSource (You will need active CustomerSource credentials) here.
The break out session talks through the key components of Power BI and Dynamics AX, as well as includes demos of key part of the process.
Breakout Session: Power BI for your Microsoft Dynamics Implementation – PPT - Recording
The lab includes a basic step by step to create a PowerView report using the Dynamics AX Demo Virtual Machine. You will require Office 365 and PowerBI to complete the last two exercises within the lab.
Instructor-led Lab: Configuring Power BI for your Microsoft Dynamics AX Implementation – Lab Document
The next post will talk through the key steps in extracting and transforming data using PowerQuery.
Thanks,
Clay.
Comments
- Anonymous
May 25, 2015
Nice information to read. This is useful to everyone.<a href="www.skillquotient.net/"><b>Microsoft Dynamics AX Training</b></a> | <a href="www.skillquotient.net/"><b>Dynamics AX Online Training</b></a>