Migrating Cassandra cluster to Azure Premium Storage (at scale!)
Background
Office 365 uses Cassandra to learn deeply about its users. Our cluster has 150 TB data and runs on 300 nodes. We use Azure D14 VMs running Ubuntu, and the data is stored on locally attached SSDs. We use spark jobs running in Azure HDI to compute insights on the "big data" stored in Cassandra cluster. We query with LOCAL_QUORUM and use a RF = 5. This architecture works great at scale, however it does impose the following restrictions / problems.
- Azure loses SSDs when it moves VMs (by design). This means we incur a data loss and the node must be hydrated from other nodes (automatically via the built in auto_bootstrap = true setting or explicitly via "nodetool rebuild"). We have observed that none of these approaches work reliably at scale, and we always risk losing some data. The operation also takes multiple days, and if another node goes down we start losing availability.
- We can not scale up / down VMs without losing data. This restricts our ability to test scaling in production.
- With RF = 5, we pay extra dollar cost. This becomes a real issue as the data size grows
To solve the problems listed above, we started investigating Azure Premium Storage. This is a latest offering from Azure that provides network attached SSD storage with a local SSD cache. The highest SKU is DS 14, and biggest disk is P30 (1 TB). With appropriate RAID configurations, Azure provides linearly scalable IOPS (1 disk provides 5000, so a RAID-0 array of 3 disks provides 15000). There is plenty of documentation online on how this can help run things at scale with reliability as key tenet.
Current Architecture 
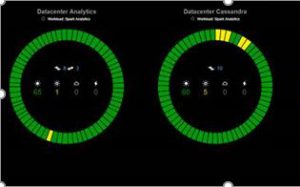
We have two Casandra rings as seen in the picture. "Analytics" runs heavy batch jobs, and "Cassandra" runs streaming jobs. Each ring contains 150 nodes and each node holds ~600 GB data. With Premium storage, we could reduce RF = 3. So we set a goal to decommission these rings and build two new rings each with 75 "dense" nodes (~900 GB) running on Premium Storage.
Initial Experimentation
We wanted to perform detailed tests as well as collect anecdotal evidence that Premium Storage will work for us. For anecdotal evidence, we replaced 4 nodes in the heavy Analytics ring with nodes running Premium Storage (one node at a time) and ran them for 2 weeks. We observed the following to confirm Premium Storage wasn't a deal breaker right away.
- Time to rebuild / auto-bootstrap the node
- Read / Write Latency
- Dropped messages / mutations
- CPU / Memory pressure
All of above did not show any significant deviation from SSD based nodes. This gave us confidence in the technology.
Prototyping
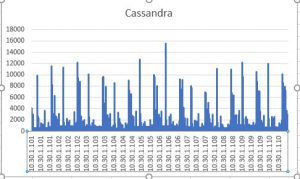
The first decision was how many P30 disk are needed on a node. So we ran "iostat -x 2" on 10 nodes in both rings and collected the numbers over 5 days. For our scenarios, iops average around 5000, and peaked to 10000 infrequently. This meant that we needed 3 P30 disks in a RAID-0 configuration. Since each P30 disk gives 1 TB, this would also satisfy our size requirements per node.


An important takeaway in this process was that the iostat must be run with really high fidelity to capture true IOPS. Since we have bursty loads, running iostat every 5 seconds did not capture the true IOPS (it shows numbers < 1000).
With this information we created a small cluster with appropriate RAID-0 setup, and used Cassandra-Stress to generate load. We observed the same metrics called out above, and ensured that the cluster behaved well under load.
Execution
We created a brand new ring named BatchAnalytics with 75 nodes. We tried to hydrate data into this ring using "nodetool rebuild".
This is where we hit our first problem.
During the rebuild process, the number of SSTables grew in huge numbers (typically they are at 2000, and grew beyond 100000 during rebuild). This caused the node to go down with OutOfMemory exceptions.
We tried changing concurrent_compactors, stream_throughput but that did not help. The yaml setting that did the trick was - memtable_cleanup_threshold. Changing this from the default of 0.2 to 0.7 made sure that we did not flush data from memory often and gave node much needed room to run compactions. This allowed us to reliably hydrate nodes in ~3 days. Note this setting is absent in the yaml file by default, so it took us quite some time / online searches to arrive at the right knob. Datastax support helped, too.
We use both Size Tiered and Date Tiered compaction strategies. A side-effect of Date Tiered Strategy during rebuilds is it doesn't compact tables quickly enough. This is probably because the "time-series" nature of data that Date Tier relies heavily on breaks during rebuild (when vnodes are used). We changed some tables to Size Tiered in the process so that the SSTables are crunched quickly, and the nodes are able to serve queries with expected latency.
We moved our heavy batch jobs to this ring and observed for 2 weeks.
This is where we hit our second problem.
The problem was that few nodes in the ring consistently died with OutOfMemoryException and a high SSTable count. As far as we knew, our load was evenly distributed (Write Requests, Read Requests did not now major deviation from other nodes), so we could not tell why this happened only on a few nodes. The nodes under question did not have abnormal wide partitions either. As mitigation, we had to manually delete SSTables and incur data loss to keep the nodes running.
We worked with Azure support (which is fantastic) to understand if storage was playing a role. Their tools did show that 5% of our operations were getting throttled, and this percentage increased on the "problematic" nodes before they died. We learnt that the throttling works somewhat differently than how we perceived it to be. Azure throttles at every 50 ms interval, so even if you are well below the 5000 IOPS limits bursty operations will lead to throttling.
With this information in mind, we added a new node to the ring with 10 P30 disks and gathered same data. Surprisingly, we saw the same throttling on this node. It seemed as if the more storage you give, the more the node would want to push.
We observed CPU, load average and GC pauses on all nodes during this process and observed that the nodes were under CPU pressure in general. We mainly debugged high CPU using jstack. The node with 10 disks was a data point in same direction. We tried various tuning approaches available online such as Kernel scheduler queue size, none of which helped. We were convinced that reducing the number of nodes from 150 to 75 was a bad idea, and we must add nodes to the ring so we can have apples-to-apples for better troubleshooting.
This is where we hit our third problem.
To make the ring build process faster, we moved the traffic back to original SSD based ring, added nodes to new ring with auto_bootstrap = false. We chose to build the ring from within (nodetool rebuild BatchAnalytics). When the nodes were built (faster as expected), we observed that the data size was lower than the typical size. This happened because the tokens had already moved to "empty" nodes, and so they could only hydrate partial data. We realized this pretty quickly, and rebuilt the nodes from other rings (like how we normally do).
We moved jobs again to the new ring. In couple days, it was clear that we were on the right path. CPU came down (from 70% to 40%), load average came down (from 30% to < 10%), and GC pauses generally went away.
We observed the ring for 3 weeks to confirm that the problem has indeed gone away.
With proof that the heavy ring works reliably for 3 weeks, we created the second ring with 150 nodes for Streaming jobs. This ring did not show any problems, as expected.
The cluster is now fully migrated to Azure Premium Storage. We have also enabled disc encryption in the process, and haven't seen any issues with it.
Takeaways
- Cassandra compute is very CPU sensitive. You need to add nodes to cluster to give it more CPU before having to give it more memory, disk etc.
- It is crucial to give changes bake time before moving forward.
- At scale, most of the typical debugging arsenal (system logs, jstack, top) won't really help. At times, you do need the "tribal knowledge" so you can look at the right places for problems. (In our case, that tribal knowledge happens to be specific gigantic tables and spark jobs)
- In hindsight, we did not have strong data to back our decision to reduce number of nodes (which was an added variable besides Premium Storage). This caused hiccups that took time to recover.
- Doing functional tests in a small environment followed by doing things in production in crucial to surface issues quickly and make progress. For example, Azure has a limit on how many VMs can live in an availability set -- we could not have found this in any other environment besides production.
- Metrics, metrics, metric ! We constantly observed read/write latency, SSTable count and CPU during the whole process to ensure stability of cluster. Having them available in a reliable UX proved very beneficial.