SQL Server Advent Calendar 19 – Data Collection
Day 19 of my virtual advent calendar, about stuff I like in SQL Server 2008..
I often get asked how much faster is SQL Server 2008 than SQL Server 2000, what impact will virtualisation have on my performance, and my answer in fine Microsoft tradition is it depends. So how can we begin to answer these questions and put some science into this area?
As a Business Intelligence expert I would suggest building a data mart to capture the performance of the system you want to measure then apply any changes you want to it and then evaluate the result. The good news is that there is a tool called data collection built into SQL Server 2008 to do a lot of the work for you. Before you ask no you can’t retro fit this onto earlier versions although you could collect similar data yourself.
Data Collection comprises of:
- a Collection mechanism which writes out telemetry information to temp files on local storage to minimise the performance overhead of collecting performance data.
- Collection Sets define what you are measuring, there are three installed:
- Disk Usage
- Query Statistics
- Server Activity
- Agent jobs to collect this data and drop it into
- A predefined data mart i.e. a central database, called the Management Data Warehouse (MDW). This means you can gather information form multiple instances and store all of it in one place.
- A set of rich standard reports that link together to tell you what’s happening.
Let’s have a look at each bit in turn..
First of all we need to define where the data is to be stored, which can be done by opening SQL Server management studio (SSMS) expanding management –> data collection –> Configure Management Data Warehouse. The wizard will either allow you to create a new one or point to one you made earlier. You can also set permissions to the predefined MDW roles from here.
Having done that you can then rerun the same wizard and select the Data Collection option. From here you specify the location of the MDW and the local cache where performance data initially gets written to.
Now you can configure each collection set by right clicking on it and selecting properties..
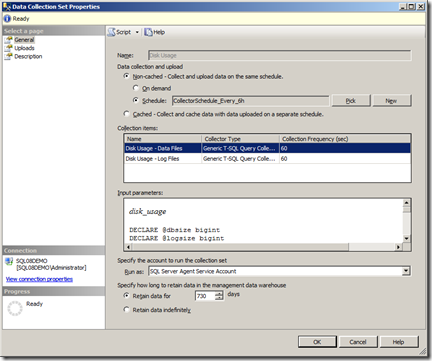
This is the Disk Usage Collection. You can see it has two items in it one for data files and one for log files. There is a predefined script for each of these and the rest of the screen allows you to specify how long to keep the data for how often the data is collected and whether to use a local cache or not.
You can add to all of this, but IMO try it ‘as is’ and see what else you need.
Once it’s up and running you can then use the predefined reports that come with it by
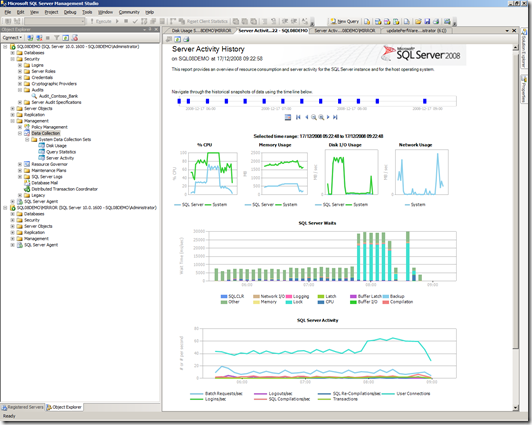
right clicking on data collection node and selecting one of the three reports listed in this case server activity gives you this…
The graphs are interactive so clicking on the plateau on the bottom graph me more info..
The time access controls these graphs as well. If you are looking at queries you can get down to the individual sql statements, and these also have linked reports embedded in them
Hopefully you get the idea, and simply turning this on with defaults will go a long way to helping you with your consolidation decisions.
Technorati Tags: SQL Server 2008,data collection,management data warehouse


