Heat maps in SQL Server Reporting Services 2005
Warm up your users this winter with heat maps in SQL Server 2005:
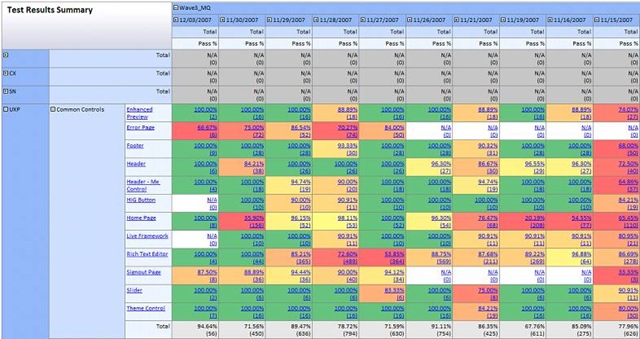
This report was created by one of our testing gurus, Patrice Brassard, and uses a to show up a dll he has written in c#. The code was used to simplify the process of applying conditional formatting in every cell of the report.
The DLL contains a static public method:
public static string GetColor(decimal redStartVal, decimal yellowStartVal, decimal greenStartVal, decimal val)
where:
- redStartVal represents the value where a pure red would be used
- yellowStartVal represents the value where a pure yellow would be used
- greenStartVal represents the value where a pure green would be used
- val is the value where you need to get a heat map colour
The function returns a string corresponding to the Hex value of the colour.
The example report above represents test results so Patrice wanted only 100.00% to be shown green (i.e.99.99% should be yellow) so he used the following values:
WLX_SSRS_Utils.HeatMap.GetColor(70.0, 99.99, 100.00, (Sum(Fields!RawPass.Value) / (Sum(Fields!RawPass.Value) + Sum(Fields!RawFail.Value) + Sum(Fields!RawNotRun.Value))) * 100.0)).
Please note that the attached DLL that needs to be on both your dev machine and the SSRS server:
- On the dev machine (say your PC), it needs to be deployed in %programfiles%\Microsoft Visual Studio 8\Common7\IDE\PrivateAssemblies
- On the reporting server, it needs to be deployed in %ProgramFiles%\Microsoft SQL Server\MSSQL.x\Reporting Services\ReportServer\bin
Technorati Tags: SQL Server 2005,Reporting Services,conditional formatting
Comments
Anonymous
December 16, 2007
Segnalo l'interessante post di Andrew Fryer sulla possibilità di colorare le celle di un report inAnonymous
February 10, 2010
Hi Andrew, I've also done a blog post on how to create Heat maps in SQL Server Reporting Services. I developed an Excel export friendly solution. http://www.arrangeactassert.com/how-to-create-heat-maps-in-sql-server-reporting-services/ Cheers, Jag