Getting Started with SparkLines in ReportBuilder 3
First you’re going to need the download and install SQL Server 2008 R2 November CTP. My step by step guide on doing that is here (which stil works with the November CTP)
Now you’re going to need to have a copy of the adventure works database from Codeplex I have used the version designed for use with SQL Server 2008 R2. You’ll need to enable FileStream support in SQL Server configuration manger if you use this one…
(right click on the instance to bring up this properties page).
You should now be able to go to Report Manager which is the web portal that comes with reporting services and should be at https://myserver/reports and will look like this..
except that yours will have no content.
From the toolbar in the portal you’ll need to select New Data Source to make a connection to get the data from..
I have not followed best practice here because I have used a very privileged account, but this is just a demo!
I have also created a folder called data sources to keep all of these in, but this is optional.
Now we can start to use Report Builder 3, by selecting that from the toolbar..
and this in turn launches a wizard. One of the new things in Reporting Services in SQL Server 2008 R2 is the ability to share data sets as well as data sources, and I am going to do that as part of this walkthrough be selecting the create shared dataset option I’ve highlighted.
I can now choose which columns I want to have in my dataset..
But be careful if you include calendar and sales in your query as I have done as the friendly query designer in Report Builder will try and join these table on three fields.. so just use the one join i.e. cut out the stuff in red..
SELECT
DimProduct.EnglishProductName
,DimProductSubcategory.EnglishProductSubcategoryName
,DimProductCategory.EnglishProductCategoryName
,DimTime.CalendarYear
,DimTime.CalendarQuarter
,DimTime.EnglishMonthName
,DimReseller.ResellerName
,FactResellerSales.SalesAmount
,FactResellerSales.OrderQuantity
FROM
DimReseller
INNER JOIN FactResellerSales
ON DimReseller.ResellerKey = FactResellerSales.ResellerKey
INNER JOIN DimTime
ON DimTime.TimeKey = FactResellerSales.OrderDateKey AND DimTime.TimeKey = FactResellerSales.DueDateKey AND DimTime.TimeKey = FactResellerSales.ShipDateKey
INNER JOIN DimProduct
ON DimProduct.ProductKey = FactResellerSales.ProductKey
INNER JOIN DimProductSubcategory
ON DimProductSubcategory.ProductSubcategoryKey = DimProduct.ProductSubcategoryKey
INNER JOIN DimProductCategory
ON DimProductCategory.ProductCategoryKey = DimProductSubcategory.ProductCategoryKey
Run the query (the exclamation mark) to check it’s returning meaningful data. Now you can save this be selecting the disk tool (just like in any office 2007 product), and you ‘ll be asked to give it a name so call it ResellerSales.
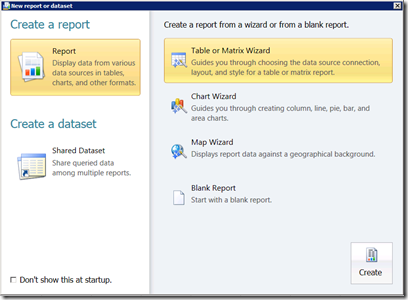
This can now be used in a new report so from the the Report Builder icon (top left – again like office) select New bring back the startup wizard again. This time select new Table or Matrix Wizard..
Browse to find the DataSet you just made..
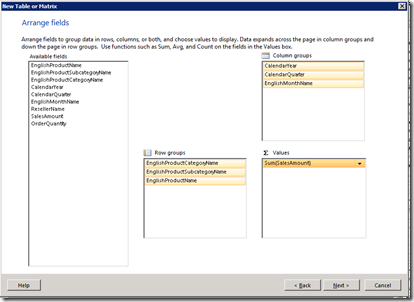
and click next to bring up the layout..
click on the image above to make it larger so you can see how to arrange your data exactly as I have. Click Next when you have
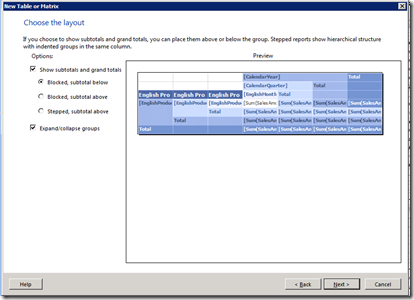
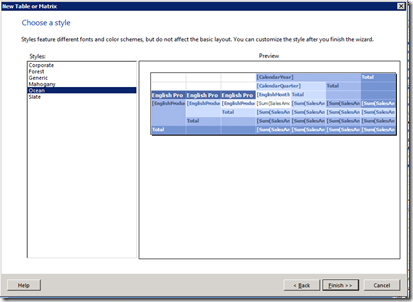
go with the defaults here and for the next screen (the theme)..
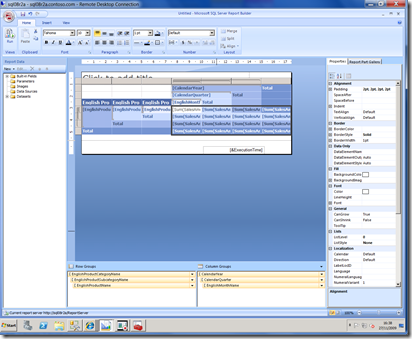
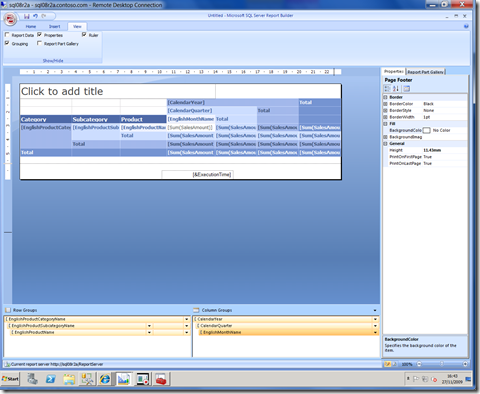
Click finish and you should see the layout you have created in the design view of RB3..
To sharpen this up you’ll want to
highlight all the numbers and set there format to C2 or N2 (currency or a number to 2 decimal places)..
widen all the columns
and rename the product columns to Category, Sub Category and Product..
If you are already familiar with Report Builder we can now start the new stuff by adding SparkLines to this..
First create a new column by selecting the product column right clicking and add column –> right like this..
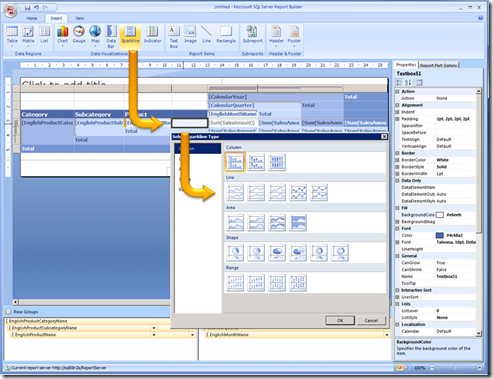
Now select the insert ribbon and you’ll see the new SaprkLines..
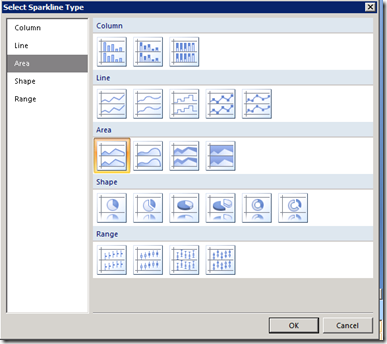
Click on it and then click on the lightest blue cell in the new column which will bring up the SparkLines Wizard
I’m going to choose this one..
and I’m simply going to click OK. You should see a little preview in the cell you selected ..
But before it will work you need to tell it what data to use so click on it..
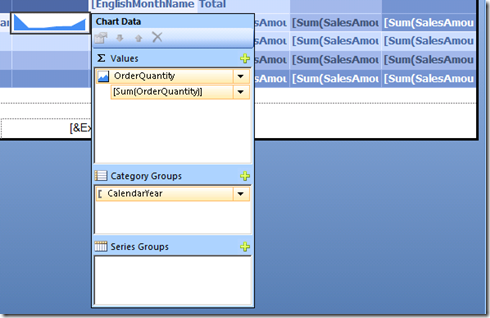
and click on the plus signs to add the fields you want to use. I have selected OrderQuantity for the values and Calendar Year for the Category Groups.
Now for the clever bit. highlight that cell and select copy and then paste it to the three rows below..
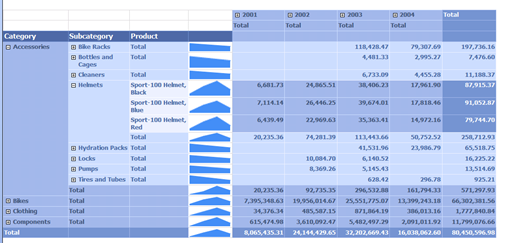
No you can run it..
Notice that as it expands each level of the hierarchy has a SparkLine for the quantity sold each year.
I have uploaded the report and the shared dataset to Skydrive for you, but you’ll have to create your own datasource to the adventure works database to use them.


