Solution Architecture For The Masses. Step 3: Design Your Cross Cutting Utilities
| | Quick Resource Box
| ||||
| In this post I will be implementing Logging & Instrumentation and Input & Data Validation security related utilities which I will be using in presentation, business logic, and data tiers. Logging & InstrumentationGeneral guidelines from Chapter 15: Web Application Archetype:
The summary of my logging and instrumentation strategy:
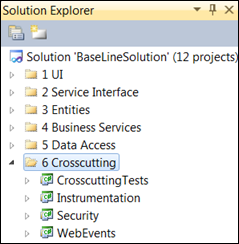
Web Events designed to work in ASP.NET Web applications or WCF Services hosted in IIS. If one day I decide to move my business logic into separate physical tier not hosted in IIS and not exposed as WCF service then Web Events might be unsuitable. On other hand, I hardly can see that day coming any soon, if any… In any case the logging mechanism is abstracted so the implementation is not visible to its consumers. Implementing InstrumentationRight click on Crosscutting folder in Visual Studio and add two new Class Library Projects – WebEvents and Instrumentation:
Right click on Instrumentation project and add new Class. Name it Tracing. Add implementation similar to the one outlined in Tracing & Instrumenting ASP.NET Application For Performance. At this moment you should be able to report entry and exit to the functions or any arbitrary messages. public class Tracing { public static void TraceFunctionEnter() { StackTrace st = new StackTrace(); Trace.WriteLine("TRC:ENTERING: " + st.GetFrame(1).GetMethod()); } public static void TraceFunctionExit() { StackTrace st = new StackTrace(); Trace.WriteLine("TRC: EXITING: " + st.GetFrame(1).GetMethod()); } public static void TraceMessage(string message) { Trace.WriteLine("TRC:" + message); } }
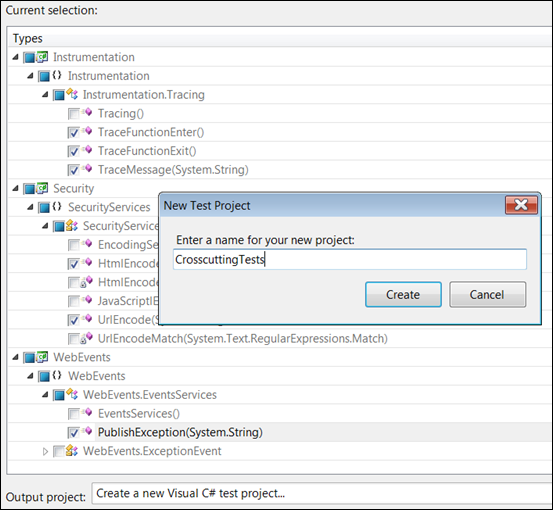
The output is published to default Trace Listener which is added by default. Use either DebugView or Procmon to collect and display the trace messages as described in Tracing & Instrumenting ASP.NET Application For Performance, Sysinternals ProcMon New & Improved – Captures Both System & Application Events. In case you are interested to remove the default listener use this configuration in Web.Config. I can’t really think of any good reason to do so. Performance? Nuh…. <system.diagnostics> <trace> <listeners> <clear/> </listeners> </trace> </system.diagnostics> Implementing LoggingNext I will implement logging using Web Events and ASP.NET Health Monitoring mechanism. Right click on WebEvents project and add new class. Name it ExceptionEvent. Add reference to System.Web, add System.Web and System.Web.Management namespaces in using declaration sections. Add the following implementation: class ExceptionEvent : WebBaseEvent { const int WebEventCode = WebEventCodes.WebExtendedBase + 1; internal ExceptionEvent(String message) : base(message, null, WebEventCode) { } } Right click on WebEvents project and add new class. Name it EeventServices. This is the abstraction of the event publishing services. Anytime I will be unsatisfied with Web Events [which I doubt] I’d go and change the implementation without breaking other layers: public class EventsServices { public static void PublishException(string message) { if (null != System.Web.HttpContext.Current) { ExceptionEvent exceptionEvent = new ExceptionEvent(message); exceptionEvent.Raise(); } else { //PROBABLY RUNNING INSIDE UNIT TEST OR //THE APP IS NOT HOSTED IN WEB SERVER //LET'S REPORT IT TO EVENTLOG string sSource = "My App"; string sLog = "Application"; if (!EventLog.SourceExists(sSource,".")) //THIS LINE FAILS WHEN NOT RUN UNDER //ADMINISTARTOR’s ACCOUNT EventLog.CreateEventSource(sSource, Log); EventLog.WriteEntry(sSource, message); } } } Configuring web events in Web.Config will be covered further when designing presentation layer, stay tuned. Implementing ValidationThis section covers basic but critical functions related to security. Specifically HTML encoding, URL encoding, and integrity check. These utilities invaluable when dealing with injection attacks. More info here: How To: Prevent Cross-Site Scripting in ASP.NET. Right click on Crosscutting and add new Visual Studio project. Name it Security. Right click on the Security project and add new class. Name it EncodingServices. Add the following implementation to the class: public class EncodingServices { public static string HtmlEncode(string x) { if (x == null) { return x; } return HttpUtility.HtmlEncode(x);} public static string UrlEncode(string x) { if (x == null) return null; return HttpUtility.UrlEncode(x); } Such abstraction might look redundant but there is a reason. In previous versions of .Net framework HtmlEncode function was encoding only <>&” characters which is insufficient. But recent implementation seem to work just fine. I will be testing it later via Unit Test. Unit Testing My SolutionRight click on any method in any class in any project under Crosscutting folder. Choose “Create Unit Tests…”. Select all methods of our interest as depicted below. Choose to create new Test project and name it CrosscuttingTests. Click Create, click OK.
Drag CrosscuttingTests project under Crosscutting folder.
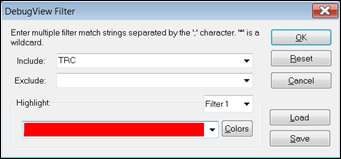
Unit Testing Tracing ServicesChange TracingTest.cs implementation so it looks as follows: [TestMethod()] public void TraceFunctionEnterTest() { Tracing.TraceFunctionEnter(); Assert.Inconclusive("Run DebugView. have you seen 'TRC: EXITING: TraceFunctionEnterTest' there?") ; } [TestMethod()] public void TraceFunctionExitTest() { Tracing.TraceFunctionExit(); Assert.Inconclusive("Run DebugView. have you seen 'TRC: EXITING: TraceFunctionExitTest' there?") ; } [TestMethod()] public void TraceMessageTest() { string message = "RUNNING UNIT TEST"; Tracing.TraceMessage(message); Assert.Inconclusive("Run DebugView. have you seen 'TRC: RUNNING UNIT TEST' there?") ; } Open DebugView. Configure to filter messages that include TRC string to avoid massive unrelated noise:
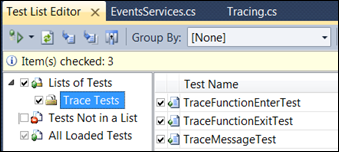
Run trace related unit tests:
As a result you should see your messages displayed in DebugView as depicted below [notice lovely Time column]:
Unit Testing Events ServicesChange EventsServicesTest.cs implementation so it looks as follows: [TestMethod()] public void PublishExceptionTest() { string message = "UNIT TESTING PublishExceptionTest"; EventsServices.PublishException(message); Assert.Inconclusive("Check Event Log, you should see 'UNIT TESTING PublishExceptionTest' there"); }
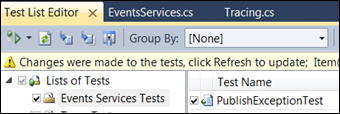
Run event publishing related tests []:
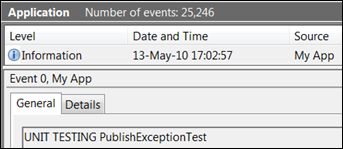
The outcome of the run should look as following in the Application Event Log:
Unit Testing Encoding ServicesChange EncodingServicesTests.cs so it looks as follows: [TestMethod()] public void HtmlEncodeTest() { string x = "<script>alert('h&cked')</script>"; //use this tool or simialr to created expected value //https://www.opinionatedgeek.com/DotNet/Tools/HTMLEncode/Encode.aspx string expected = "<script>alert('h&cked') </script>"; string actual; actual = EncodingServices.HtmlEncode(x); Assert.AreEqual(expected, actual); } [TestMethod()] public void UrlEncodeTest() { string x = "<script>alert('h&cked')</script>"; //use this tool or simialr to created expected value //https://www.opinionatedgeek.com/dotnet/tools/urlencode/Encode.aspx string expected = "%3cscript%3ealert(%27h%26cked%27)%3c%2fscript% 3e"; string actual; actual = EncodingServices.UrlEncode(x); Assert.AreEqual(expected, actual); } Run your encoding related tests:
You should pass the test:
At this point I have created and tested basic crosscutting services I will be using in the rest of the layers. The services include Tracing, Event Publishing, and Input Sanitation [HTML and URL encoding]. Related Books | |||||
![image_thumb[6] image_thumb[6]](https://msdntnarchive.z22.web.core.windows.net/media/TNBlogsFS/BlogFileStorage/blogs_msdn/alikl/WindowsLiveWriter/Sol.Step3DesignYourCrossCuttingUtilities_C6A7/image_thumb%5B6%5D_376e66ac-4452-468f-9f0a-f6bfc1168901.png)
