ASP.NET Performance: Dynamically Loaded Assemblies Cause Application Recycles (Problem and Solution)
Customer Case Study
The customer complained on periodic restarts/recycles of the ASP.NET application. We observed relative entries in the Event Log that showed up systematically on timely basis. We also observed memory utilization growth in Task Manager. After reaching 500 MB of memory utilization the application would recycle spawning another w3wp.exe to accept new incoming requests while draining the old w3wp.exe.
Analysis
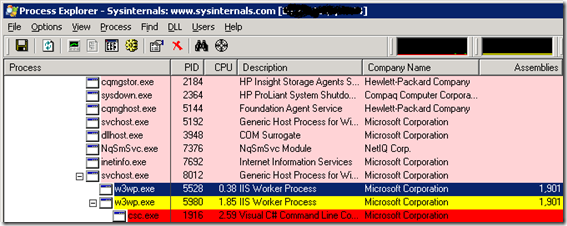
After short discussion with the dev team about the design of the application we thought that the memory leak might be caused by improper usage of XmlSerializer that generate dynamic assemblies. Tess published fantastic walk through specifically dedicated to this case. Using either perfmon (.NET CLR Loading\Current Assemblies) or Process Explorer (see pic below)we observed unusual number (thousands) of loaded assemblies (notice Assemblies column). Also, notice the csc.exe in red - this is CSharp compiler that is invoked on each request:
We decided to take a memory dump to deeply investigate the case. Following are the steps that we took while analyzing the dump using WinDBG to identify the root cause:
Step 1 - Dumping memory heap to identify object allocated on heap
This is the fragment of the long list of objects. Our attention was caught by unusually large number of reflected assemblies.
!dumpheap –stat
9,019 216,456 System.Reflection.Assembly
112 4,032 System.Xml.Serialization.TempAssembly
104 5,408 System.Xml.Serialization.TypeDesc
After 3 minutes the number of dynamic assemblies is larger by more 350 assemblies (from subsequent dump):
!dumpheap –stat
9,379 225,096 System.Reflection.Assembly
114 4,104 System.Xml.Serialization.TempAssembly
102 5,304 System.Xml.Serialization.TypeDesc
Step 2 - Dumping appdomains to identify loaded assemblies
Another cross check to make sure we are dealing with tons of loaded assemblies.
!dumpdomain -stat
Domain Num Assemblies Size Assemblies Name
0x793f15d8 1 2,142,208 System Domain
0x793f2aa8 56 16,012,288 Shared Domain
0x000ab7d8 2 2,498,560 DefaultDomain
0x000d3368 9,018 55,447,040 /LM/W3SV......
Total 4 Domains, Total Size 76,100,096
Step 3 - Dumping all dynamic assemblies
How many of the assemblies are dynamic? (dda stands for dumpdynamicassemblies)
!dda
Domain: 0x793f15d8
-------------------
Domain: .
-------------------
Domain: DefaultDomain
-------------------
Domain: /LM/W3SVC/1/ROOT/......
-------------------
Assembly: 0x19058818 [RegexAssembly133_0] Dynamic Module: 0x16f4c220 loaded at: 0x0 Size: 0x0((null))
Assembly: 0x19058818 [RegexAssembly133_0] Dynamic Module: 0x190696a0 loaded at: 0x0 Size: 0x0((null))
Assembly: 0x19103ee8 [-0g5u8-v] Dynamic Module: 0x1920d6f8 loaded at: 0x19911000 Size: 0xc000((null))
Assembly: 0x190c9a40 [cvmmynwf] Dynamic Module: 0x190dc0d0 loaded at: 0x19a71000 Size: 0x4000((null))
Assembly: 0x1911bad8 [0ikhy_lx] Dynamic Module: 0x1911aa98 loaded at: 0x19f21000 Size: 0xc00((null))
.......
Assembly: 0x43199720 [nv1lvdiy] Dynamic Module: 0x431b3190 loaded at: 0x4cf61000 Size: 0xc00((null))
Assembly: 0x2d2bf008 [rk6dabem] Dynamic Module: 0x2d2bf258 loaded at: 0x4cf71000 Size: 0xc00((null))
--------------------------------------
Total 8,911 Dynamic Assemblies, Total size: 0x1d5b600(30,782,976) bytes.
Step 4 - Saving dynamic assembly to physical DLL
Save assemblies to the filesystem
!savemodule 0x2d2bc4c8 C: \0x1c344438.dll
To save all the assemblies to the file system use the following command:
!dda -save C:\MODULES
Step 5 - Using Reflector to reverse engineer the DLL:
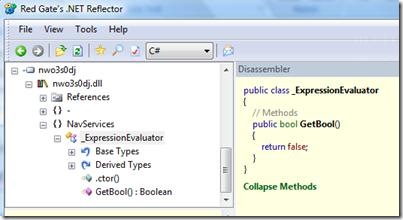
Use Reflector to inspect the implementation/source code of the dynamic assemblies.
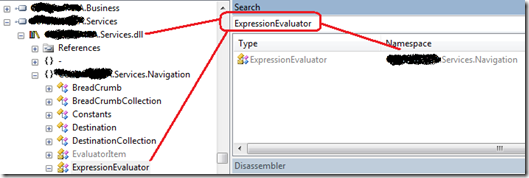
Step 6 - Using Reflector to find ExpressionEvaluator class
Try to locate the class in the static assemblies hopefully hitting the code that generates it:
Step 7 - Bingo! Each constructor for ExpressionEvaluator invokes compiler
ICodeCompiler compiler = new CSharpCodeProvider().CreateCompiler();
...
CompilerResults results = compiler.CompileAssemblyFromSource(options, builder.ToString());
...
this._Compiled = results.CompiledAssembly.CreateInstance("NavServices._ExpressionEvaluator");
This is actually the code that causes Process Explorer to show csc.exe under w3wp.exe (see red line in the first pic). And this is the code that caused number of loaded assemblies to grow. And this is the code that caused the application restarts.
Acknowledgements
During this investigation the following resources were used. Big THANK-YOU goes to:
- Tess - .NET Memory Leak: XmlSerializing your way to a Memory Leak
- Tom - Dynamic Assemblies and what to do about them
- Johan - Getting started with windbg - part I
- Cuko - OutOfMemory & CompiledAssembly
Related Materials
- ASP.NET Performance: High CPU Utilization Case Studies And Solutions
- Use FREE Tools From IIS Resource Kit To Warm Up Your ASP.NET 1.1 Application By Batch Compilation
This template is made with PracticeThis.com plugin for Windows Live Writer
Comments
- Anonymous
October 08, 2008
You've been kicked (a good thing) - Trackback from DotNetKicks.com - Anonymous
October 08, 2008
.NET Richmond Code Camp 2008.2 - Functional C# Recap ASP.NET MVC with NHaml - F# Edition Formatting strings - Anonymous
October 08, 2008
.NET RichmondCodeCamp2008.2-FunctionalC#RecapASP.NETMVCwithNHaml-F#EditionForm... - Anonymous
October 08, 2008
.NET Richmond Code Camp 2008.2 - Functional C# Recap ASP.NET MVC with NHaml - F# Edition Formatting strings


