PowerPivot to the People
The two most important assets in an organization are its people and its information. Organizations that can connect the two seamlessly empower their employees to make the best decisions. IT Departments are challenged with the task of making this connection. At the backend, products like SQL Server 2008, and subsequently SQL Server 2008 R2, have advanced the capabilities of gathering organizations’ information into central data warehouses, but users have still relied on the IT Department to deliver reports. That is about to change.
In an ideal situation, a user would be able to connect to one or more data sources, possibly in different formats, combine that data and show it in a familiar tool, analyse the information and publish it for other people to take advantage of. This scenario is now possible. Using Excel 2010, SharePoint Server 2010 and PowerPivot, users can do exactly this. PowerPivot comes in two versions, PowerPivot for Excel 2010 and PowerPivot for SharePoint 2010.
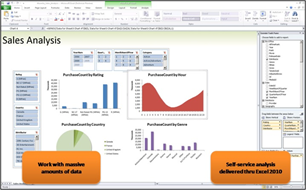
The new Excel 2010 version allows users to create a PowerPivot workbook. A PowerPivot workbook is a regular, Excel workbook (.xlsx) file. It contains PowerPivot data and Excel data visualization objects such as PivotTables and PivotCharts that you use to present this data. In addition, the row and column limitation in Excel is removed allowing you to import millions of rows of data to analyse.
One key component is the data relationship layer that lets you integrate data from different sources and work with all of it holistically. You can still enter data, or copy data from other worksheets, or import data from databases. By using the mapping functionality, you can map columns that contain similar or identical data, and then build relationships between that data even if they are from completely different data sources. When you build relationships in the data, you create something entirely new in Excel that you can use in PivotTables, PivotCharts, or any Excel data presentation object. The data also stays inside the workbook. Neither the user nor the IT Department need manage external data connections. If you publish, move, copy, or share a workbook, all the data goes with it. One concern would be size. If you import millions of rows of data, how big will that make this Excel workbook? Well, the data is highly compressed, creating a file that is a manageable size on a client workstation. It is also easy to save into SharePoint without going over any file size limitation, and it won’t create long delays in downloading.
How does it work? PowerPivot data in an Excel workbook is an Analysis Services data source that requires an Analysis Service server instance. On the client, the Analysis Services server runs in-process within Excel. On SharePoint, Analysis Services runs on an application server where it is paired with the PowerPivot System Service to handle server-side requests for PowerPivot data. Excel Services and SQL Server PowerPivot for SharePoint enable sharing of PowerPivot workbooks in a farm.
PowerPivot for SharePoint adds services and infrastructure for loading and unloading PowerPivot data. In contrast with other, large BI data sources that are limited in number and closely managed by database specialists, PowerPivot data is managed by services and infrastructure. At any given time, there might be tens or hundreds of PowerPivot workbooks open in memory on application servers in the farm. The PowerPivot System Service tracks this activity, setting up new connections to data that is already loaded in memory. It caches or unloads data if it is no longer used or when there is contention for system resources. Server health data and other usage data is gathered and presented in reports to give you an insight into how well the system is performing.
Organizations looking to utilize the data they have, regardless of where it is stored, and then empower employees to analyze this data with familiar tools, should be excited about these new developments. Microsoft’s vision to deliver cost effective Business Intelligence to everyone has taken a big step forward. In the next part, we will look at developments in the reporting space.
Additional Resources
PowerPivot for Excel 2010 and SharePoint 2010
Introduction to the Microsoft BI Technology Stack
Self Service Business Intelligence- Project Gemini
Comments
- Anonymous
August 31, 2011
Great article on PowerPivot!~
