Quickstart: Debug HTML and CSS
Note
This article applies to Visual Studio 2015. If you're looking for the latest Visual Studio documentation, see Visual Studio documentation. We recommend upgrading to the latest version of Visual Studio. Download it here
Applies to Windows and Windows Phone](../Image/windows_and_phone_content.png "windows_and_phone_content")
For JavaScript apps, Visual Studio provides a comprehensive debugging experience that includes features that are familiar to Internet Explorer and Visual Studio developers. These features are supported for Windows 8.x Store, Windows Phone Store apps, and for apps created using Visual Studio Tools for Apache Cordova
Using the interactive debugging model provided by the DOM inspection tools, you can view and modify the rendered HTML and CSS code. You can do all this without stopping and restarting the debugger.
In this topic:
-
For additional info on using the DOM Explorer, see the following topics:
-
For info on other JavaScript debugging features, such as using the JavaScript Console window and setting breakpoints, see QuickStart: Debug JavaScript and Debug apps in Visual Studio.
Inspecting the live DOM
DOM Explorer shows you a view of the rendered page, and you can use DOM Explorer to change values and immediately see the results. This enables you to test changes without stopping and restarting the debugger. The source code in your project doesn't change when you interact with the page by using this method, so when you find the desired code corrections, you make the changes to your source code.
Tip
To avoid stopping and restarting the debugger when you make changes to your source code, you can refresh your app by using the Refresh Windows app button on the Debug toolbar (or by pressing F4). For more info, see Refresh an app (JavaScript).
You can use DOM Explorer to:
Navigate the DOM element subtree and inspect rendered HTML, CSS, and JavaScript code.
Dynamically edit attributes and CSS styles for rendered elements and immediately see the results.
Inspect how CSS styles have been applied to page elements, and trace the rules that have been applied.
When debugging apps, you often need to select elements in DOM Explorer. When you select an element, the values that appear on the tabs on the right side of the DOM Explorer automatically update to reflect the selected element in DOM Explorer. These are the tabs: Styles, Computed, Layout. Windows Store apps also support the Events and Changes tabs. For more info about selecting elements, see Selecting elements.
Tip
If the DOM Explorer window is closed, choose Debug>Windows > DOM Explorer to re-open it. The window only appears during a script debugging session.
In the procedure that follows, we'll go through the process of interactively debugging an app by using DOM Explorer. We'll create an app that uses a FlipView control and then debug it. The app contains several errors.
Warning
The following sample app is a Windows Store app. The same features are supported for Cordova, but the app would be different.
To debug by inspecting the live DOM
Create a new solution in Visual Studio by choosing File > New Project.
Choose JavaScript > Store, choose either Windows Apps or Windows Phone Apps, and then choose Blank App.
Type a name for the project, such as
FlipViewApp, and choose OK to create the app.In the BODY element of default.html, add this code:
<div id="flipTemplate" data-win-control="WinJS.Binding.Template"
         style="display:none">
    <div class="fixedItem" >
        <img src="#" data-win-bind="src: flipImg" />
    </div>
</div>
<div id="fView" style="width:100px;height:100px"
    data-win-control="WinJS.UI.FlipView" data-win-options="{
    itemDataSource: Data.items.dataSource, itemTemplate: flipTemplate }">
</div>
Open default.css, and add the following CSS:
#fView {
    background-color:#0094ff;
    height: 100%;
    width: 100%;
    margin: 25%;
}
Replace the code in default.js with this code:
(function () {
    "use strict";

    var app = WinJS.Application;
    var activation = Windows.ApplicationModel.Activation;

    var myData = [];
    for (var x = 0; x < 4; x++) {
        myData[x] = { flipImg: "/images/logo.png" }
    };

    var pages = new WinJS.Binding.List(myData, { proxy: true });

    app.onactivated = function (args) {
        if (args.detail.kind === activation.ActivationKind.launch) {
            if (args.detail.previousExecutionState !==
            activation.ApplicationExecutionState.terminated) {
                // TODO: . . .
            } else {
                // TODO: . . .
            }
            args.setPromise(WinJS.UI.processAll());

            updateImages();
        }
    };

    function updateImages() {

        pages.setAt(0, { flipImg: "https://go.microsoft.com/fwlink/?LinkID=223195" });
        pages.setAt(1, { flipImg: "https://go.microsoft.com/fwlink/?LinkID=223196" });
        pages.setAt(2, { flipImg: "https://go.microsoft.com/fwlink/?LinkID=223197" });
    };

    app.oncheckpoint = function (args) {
    };

    app.start();

    var publicMembers = {
        items: pages
    };

    WinJS.Namespace.define("Data", publicMembers);

})();
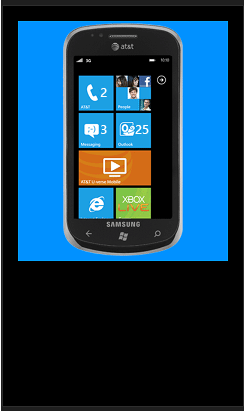
The following illustration shows what we want to see if we run this app in the Phone Emulator (it looks similar in the Simulator). However, to get the app into this state we will have to fix a number of bugs first.
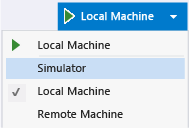
Choose either Simulator or Emulator 8.1 WVGA 4 inch 512MB from the drop-down list next to the Start Debugging button on the Debug toolbar:
Choose Debug > Start Debugging, or press F5, to run your app in debug mode.
This runs the app in the Simulator or the Phone Emulator, but you'll see a mostly blank screen because the styling has a few bugs in it. The first
FlipViewimage appears in a small square near the middle of the screen.If you're running the app in the Simulator, choose the Change resolution toolbar command on the right of the Simulator to configure a screen resolution of 1280 x 800. This will ensure that values shown in the following steps match what you see in the Simulator.
Switch to Visual Studio and choose the DOM Explorer tab.
Tip
You can press Alt+Tab or F12 to switch between Visual Studio and the running app.
In the DOM Explorer window, select the DIV element for the section that has an ID of
"fView". Use the arrow keys to view and select the correct DIV element. (The right arrow key allows you to view an element’s children.)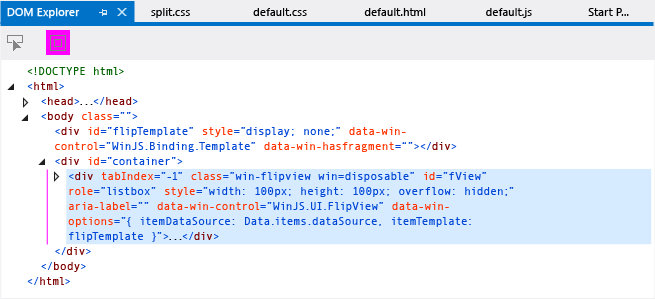
Tip
You can also select the DIV element in the lower left corner of the JavaScript Console window by typing
select(fView)at the >> input prompt and then pressing Enter.The values that appear on the tabs on the right side of the DOM Explorer window automatically update to reflect the current element in DOM Explorer.
Choose the Computed tab on the right.
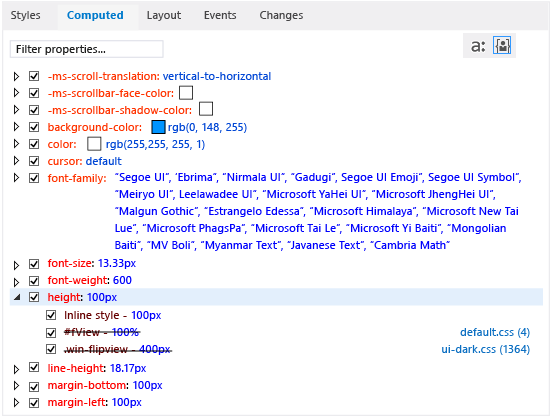
This tab shows the computed, or final, value for each property of the selected DOM element.
Open the height CSS rule. Notice that there’s an inline style set to 100px, which appears inconsistent with the height value of 100% set for the
#fViewCSS selector. Strikethrough text for the#fViewselector indicates that the inline style is taking precedence over this style.The following illustration shows the Computed tab.
In the main DOM Explorer window, double-click the inline style for the height and width of the
fViewDIV element. You can now edit the values here. In this scenario, we want to remove them completely.Select
width: 100px;height: 100px;, press the Delete key, and then press Enter. After you press Enter, the new values are immediately reflected in the Simulator or the Phone Emulator, although you haven't stopped your debugging session.Important
As you can update attributes in the DOM Explorer window, you can also update values that appear on the Styles, Computed, and Layout tabs. For more info, see Debug CSS styles using DOM Explorer and Debug layout using DOM Explorer.
Switch to the app by selecting the Simulator or the Phone Emulator, or by using Alt+Tab.
Now the
FlipViewcontrol appears larger than the Simulator's or the Phone Emulator's screen size. This is not the intended result. To investigate, switch back to Visual Studio.In the DOM Explorer, select the Computed tab again and open the height rule. The fView element still shows a value of 100%, as expected from the CSS, but the computed value is equal to the Simulator's screen height (for example, 800px or 667.67px), which is not what we want for this app. To investigate, you can remove the height and width for the
fViewDIV element.In the Styles tab, uncheck the height and width properties for the
#fViewCSS selector.The Computed tab now shows a height of 400px. The information indicates that this value comes from the .win-flipview selector specified in ui-dark.css, which is a platform CSS file.
Switch back to the app.
Things have improved. However, there is still one more problem to fix: the margins appear too large.
To investigate, switch to Visual Studio and choose the Layout tab to look at the element’s box model.
In the Layout tab, you'll see the following values:
For the Simulator: 320px (Offset) and 320px (Margin).
For the Phone Emulator: 100px (Offset) and 100px (Margin).
The following illustration shows how the Layout tab looks if you're using the Phone Emulator (100px offset and margin).
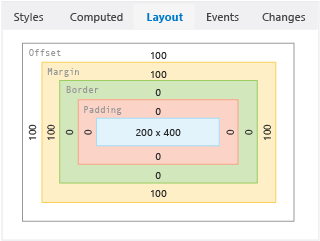
This doesn’t seem right. The Computed tab also shows the same margin values.
Choose the Styles tab and locate the
#fViewCSS selector. Here, you see a value of 25% for the margin property.Select the 25% and change it to 25px, and press Enter.
Also in the Styles tab, choose the height rule for the .win-flipview selector and change 400px to 500px, and press Enter.
Switch back to the app and you see that the placement of elements appears correct. To make fixes to the source and refresh the app without stopping and restarting the debugger, see the following procedure.
To refresh your app while debugging
While the app is still running, switch to Visual Studio.
Open default.html and modify your source code by changing the height and width of the
"fView"DIV element to 100%.Choose the Refresh Windows app button on the Debug toolbar (or press F4). The button looks like this:
 .
.The app pages reload and the Simulator or Phone Emulator returns to the foreground.
For more info about the Refresh feature, see Refresh an app (JavaScript).
Selecting elements
You can select DOM elements in three ways when debugging an app:
By clicking on elements directly in the DOM Explorer window (or by using the arrow keys).
By using the Select Element button (Ctrl+B).
By using the
selectcommand, which is one of the JavaScript Console commands.When you use the DOM Explorer window to select elements, and rest the mouse pointer on an element, the corresponding element is highlighted in the running app. You must click on the element in DOM Explorer to select it, or you can use the arrow keys to highlight and select elements.You can also select elements in DOM Explorer by using the Select element button. The following illustration shows the Select Element button.

When you click Select element (or press Ctrl+B), this changes the selection mode so that you can select an item in DOM Explorer by clicking it in the running app. The mode changes back to normal selection mode after a single click. When you click Select element, the app comes to the foreground and the cursor changes to reflect the new selection mode. When you click the outlined element, DOM Explorer returns to the foreground with the specified element selected.
Before you choose Select Element, you can specify whether to highlight elements in the running app by toggling the Display web page highlights button. The following illustration shows this button. Highlights are displayed by default.

When you choose to highlight elements, elements that you hover over in the Simulator are highlighted. Colors for highlighted elements match the box model that appears in the Layout tab of DOM Explorer.
Note
Highlighting elements by hovering over them is only partially supported in the Windows Phone Emulator.
For an example that demonstrates how to select elements by using the Select element button, see Debug CSS styles using DOM Explorer.
Browser and Platform Support
The Visual Studio tools for JavaScript, the DOM Explorer, and the JavaScript Console window are supported on the following platforms:
Windows 8.x Store and Windows Phone Store apps using JavaScript and HTML
Internet Explorer 11 running on Windows 8.1
Internet Explorer 10 running on Windows 8
Go here to download Windows 8 and Visual Studio.
See Also
Debug apps in Visual Studio
Debug CSS styles using DOM Explorer
Debug layout using DOM Explorer
View DOM event listeners
Refresh an app (JavaScript)
Debug a WebView control
Keyboard shortcuts
JavaScript Console commands
Debug HTML, CSS, and JavaScript sample code
Product Support and Accessibility