Workflow example 3: Collect response data for a nonlinear guide created in Dynamics 365 Guides
If you have created a nonlinear (branching) guide in Microsoft Dynamics 365 Guides, you can collect the data on which responses are selected by the operator. For example, you might have a nonlinear guide that provides three choices, based on a gauge temperature reading.
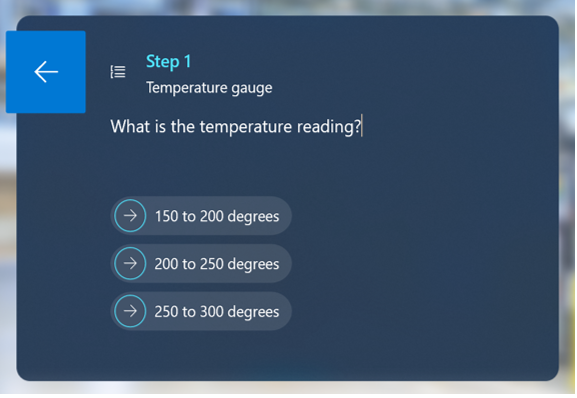
You can count the number of times the Step ID for each response is selected to know how often a particular issue occurs.
Note
You must have the Environment Maker role (Power Platform) to create a Microsoft Power Automate flow.
What you’ll learn in this example
Find the Step ID for a response step
Export a guide's event data to Microsoft Excel and match it to Step ID data
Set up a condition in Microsoft Power Automate to export the event data for a guide to a particular column in a Microsoft Excel spreadsheet
Estimated time to complete: 10 minutes for either workflow solution
Two ways to collect response data
You can collect response data in two different ways:
After the guide event (response selection) has been executed
In real time with Microsoft Power Automate as the event is executed
Get the Step ID for each response step, regardless of which method you choose. This example shows you how to get the Step ID and how to use the Step ID for either scenario.
Get the Step ID for a response step
You can use the Guides model-driven app to get the Step ID for a response step.
Go to make.powerapps.com.
Select Apps, and then select Guides.
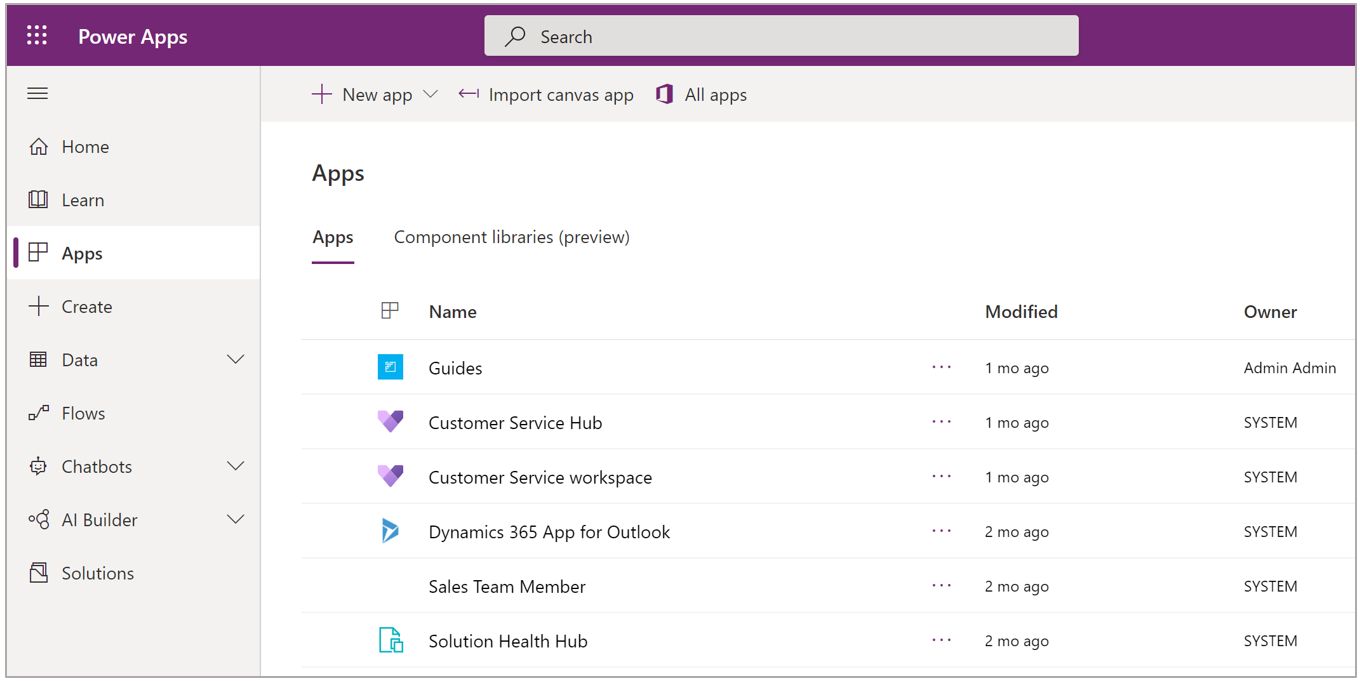
Select the appropriate guide in the list.
Select the Steps tab to display the step information for the guide.
For this example, we have a question step and three response steps.
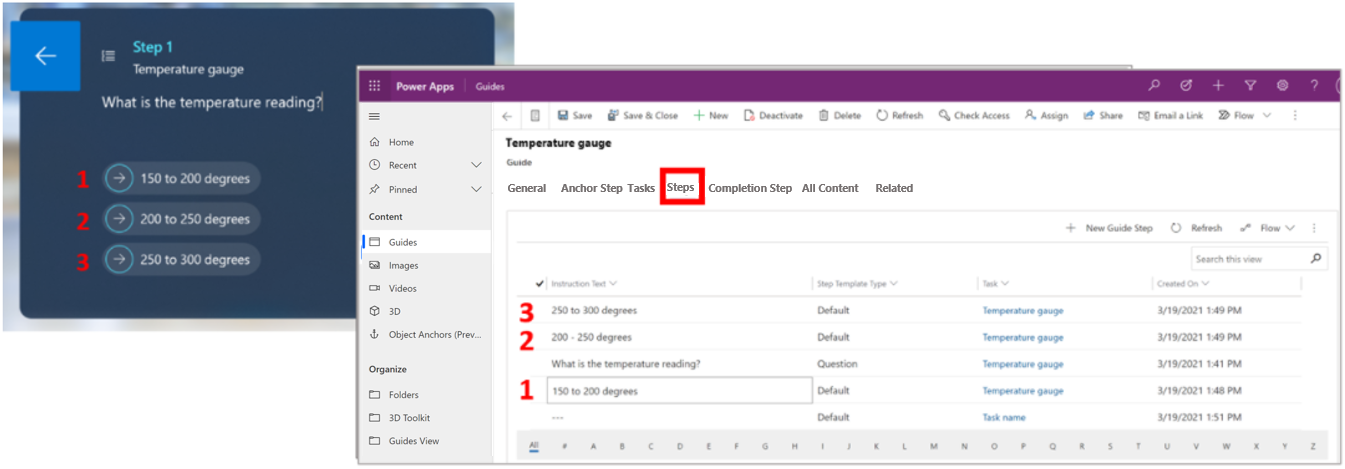
To get the Step ID for a response step, double-click the step in the model-driven app. The Step ID appears at the end of the page url in the resulting screen.

Collect response data after the event has been executed
Copy the Step ID for each response step into an Excel spreadsheet. The spreadsheet looks something like this when you’re done:

Use the model-driven app to export the guide event data.
Go to powerapps.com and select the appropriate environment.
In the left navigation pane, select Data, and then select Tables.
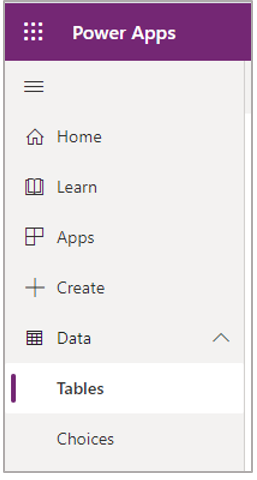
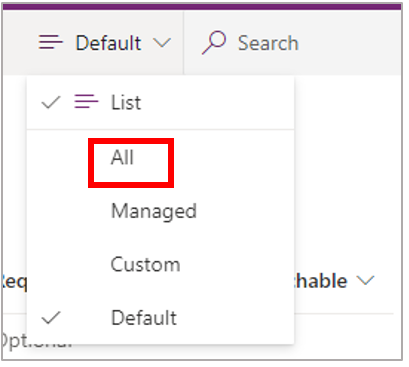
On the right side of the screen, change the view to All to view all tables.
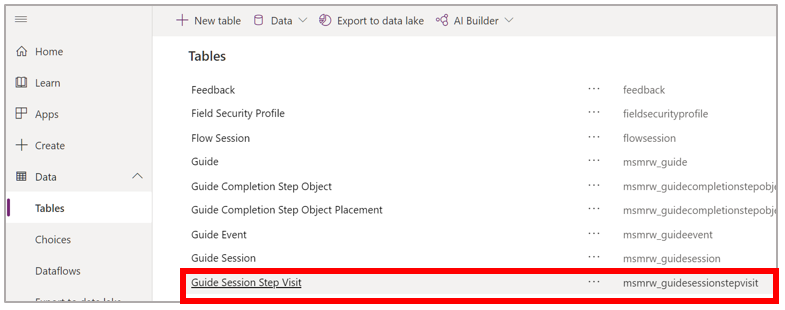
Select the Guide Session Step Visit table.
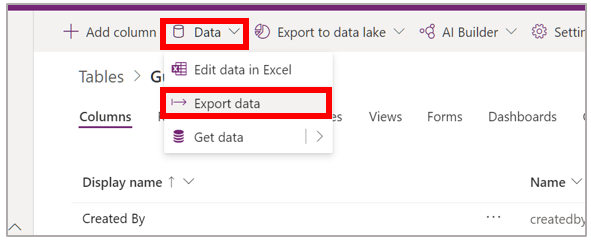
At the top of the screen, select Data, and then select Export data.
The Step ID information is in column R of the Excel spreadsheet.
Parse the Step Id column in the exported spreadsheet to check for the Step ID's. For example, the following Excel formula compares the event data in the exported Guide Session Step Visit spreadsheet to the Step Ids copied in the first step of this procedure. The formula returns a 1 if it matches an ID or a 0 if it doesn’t.
=IF(ISNUMBER(SEARCH(B$2,'Guide Session Step Visit'!R2)),1,0)
The parsed and summed spreadsheet data looks something like this.

Collect response data in real time by using Power Automate
Collecting response data in real time by using Power Automate requires four steps:
Create an Excel spreadsheet with the appropriate columns
Create a Power Automate flow that:
Is triggered when the guide event is created (when a user selects a response step)
Sets a condition for the guide event Step Id field that contains the Step ID
Writes the date to the Excel spreadsheet
Create the spreadsheet
Create an Excel spreadsheet with columns that match your response steps and a column to record the date/time the response was selected. For example, for the temperature gauge guide, the spreadsheet would include these four columns:
Date
150 to 200 degrees
200 to 250 degrees
250 to 300 degrees
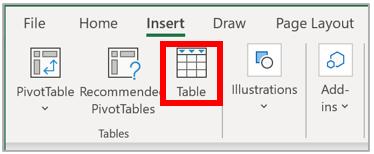
After creating the columns, select them, and then select Insert > Table. Populate this table with the Power Automate flow.
Create the flow
Sign in to Power Automate.
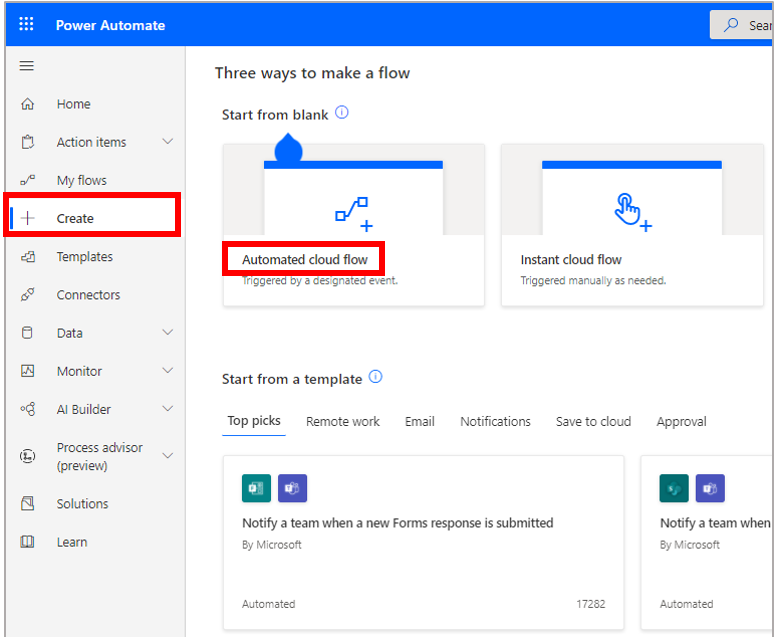
Select Create, and then select Automated cloud flow.
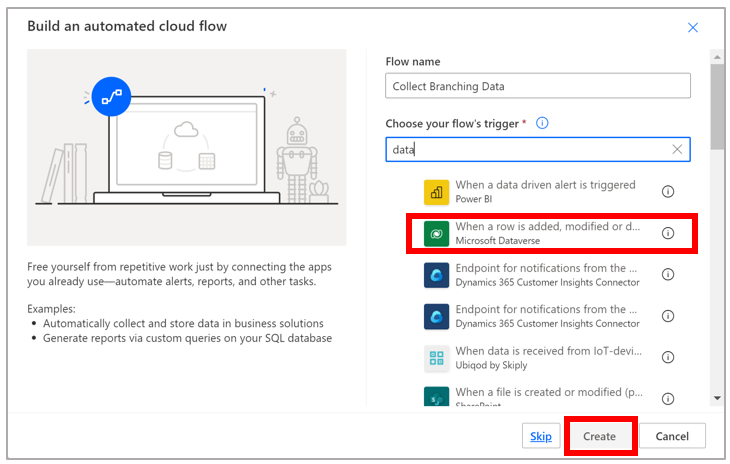
Give your flow a name, select the When a row is added, modified, or deleted trigger, and then select Create.
Tip
You can filter the list of triggers to just the Microsoft Dataverse triggers by entering the word data in the Choose your flow’s trigger box.
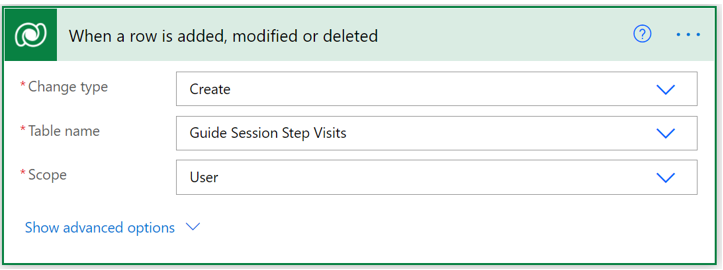
In the When a row is added, modified or deleted trigger:
In the Change type field, select Create.
In the Table name field, select Guide Session Step Visits.
Select a scope.
Select New step, and then select Condition.
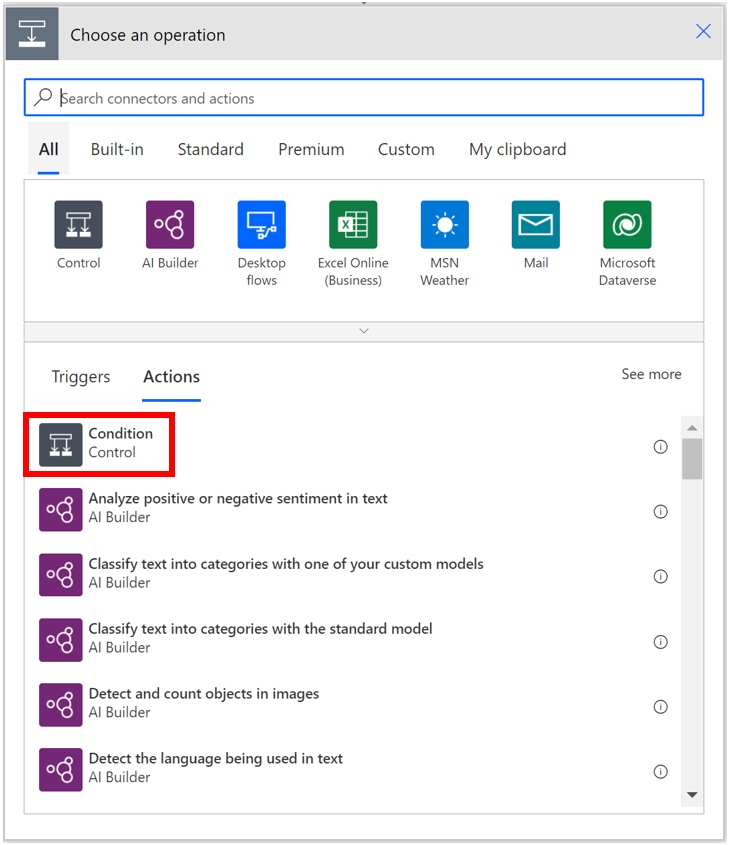
Create a condition where the Step Id field contains one of the response Step Ids.

In the If yes box for the condition, select the Excel Online (Business) category, and then select the Add a row into a table action.
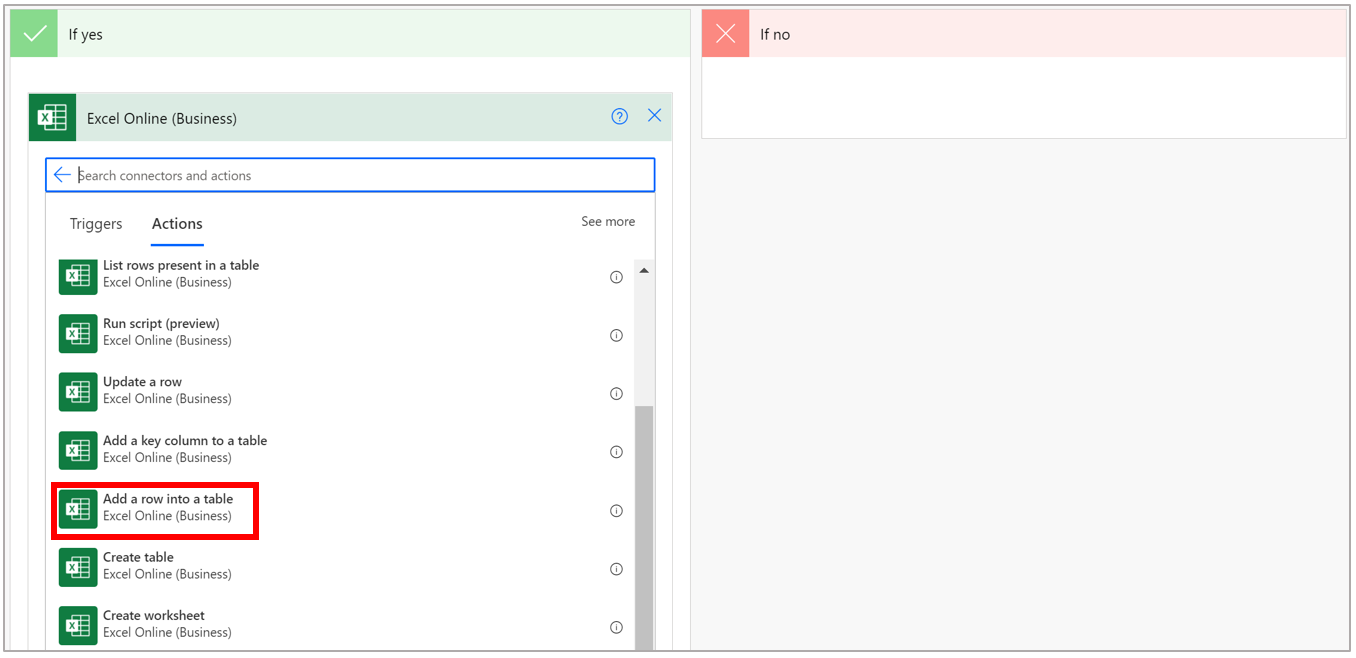
Fill out the fields for the Add a row into a table action. For example, for the temperature gauge guide, select/enter the following data.
Field Value Description Location OneDrive for Business Cloud location for the file. You can select OneDrive for Business or a SharePoint site. Document Library OneDrive The library for the cloud location File Guides Response Data.xlxs The name of your Excel file Table Table 1 The table that you created in Microsoft Excel Date Created On field (you can select this value dynamically after you place the cursor in the field) Records the date and time when the selection was made in the guide 150 to 200 degrees 1 Column in the Excel spreadsheet. Enter a 1 if the column aligns with the Step ID in the condition or a 0 if it doesn’t. 200 to 250 degrees 0 Column in the Excel spreadsheet. Enter a 1 if the column aligns with the Step ID in the condition or a 0 if it doesn’t. 250 to 300 degrees 0 Column in the Excel spreadsheet. Enter a 1 if the column aligns with the Step ID in the condition or a 0 if it doesn’t. The following screenshot shows the fields filled in for the Temperature gauge guide.
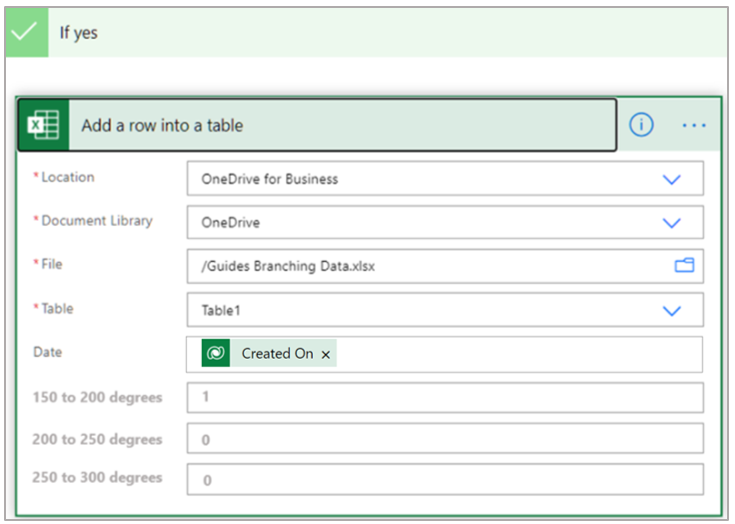
This condition gets the Step ID for the 150 to 200 degrees step and puts a 1 in the 150 to 200 column in the Excel spreadsheet when the Step Id field contains that Step ID.
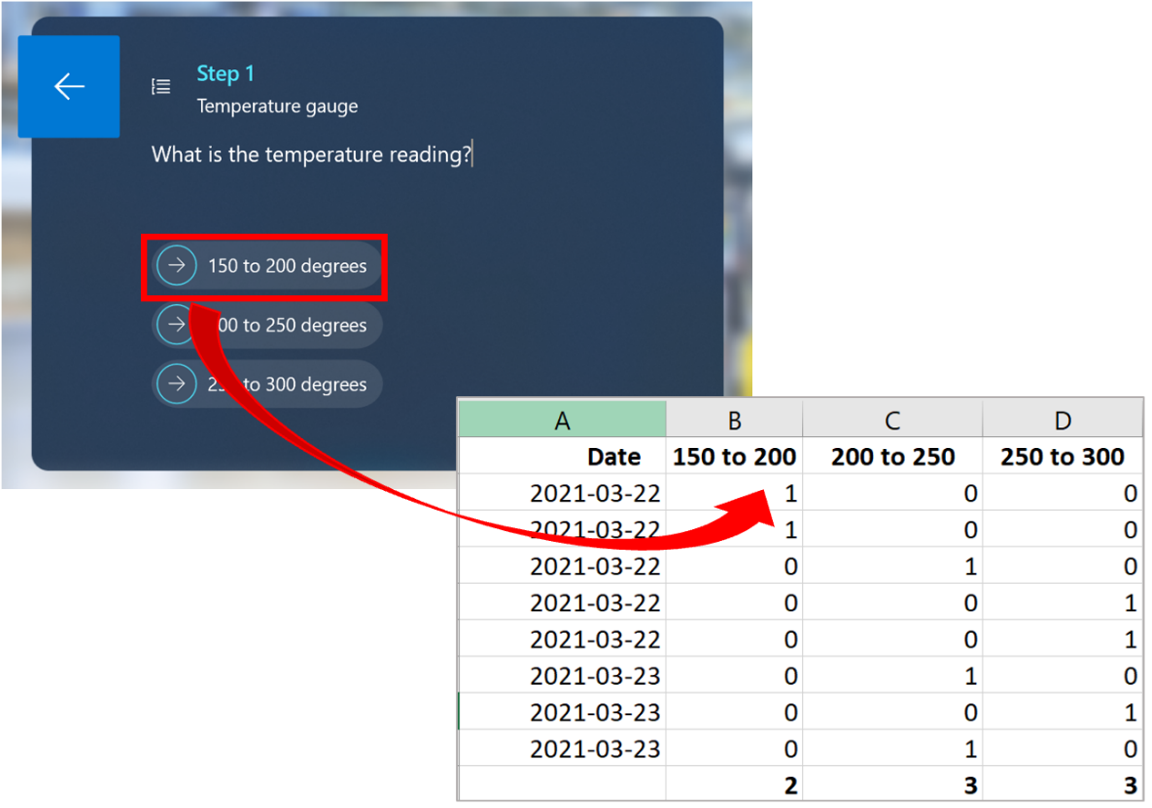
You can then tabulate, graph, and analyze the data in Excel.
Repeat steps 5 through 8 for the two other response Step Ids.
Test the flow
Select Save in the upper-right corner of the screen.
To test the flow, in the upper-right corner of the screen, select Test, select Manually, and then select Test.
In the Run flow pane, select Run flow.