Application Insights for Azure VMs and virtual machine scale sets
This article explains how to enable Application Insights monitoring through autoinstrumentation for IIS-hosted ASP.NET and ASP.NET Core applications on Azure Virtual Machines and Azure Virtual Machine Scale Sets. It covers how to deploy the Application Insights Agent using a virtual machine extension, which autocollects the same dependency signals as the SDK, and provides guidance for automating large-scale deployments with PowerShell.
Note
For Java applications, use the Application Insights Java 3.0 agent, which autocollects the most popular libraries, frameworks, logs, and dependencies, along with many other configurations.
Node.js and Python applications running on Azure VMs and Azure Virtual Machine Scale Sets don't support autoinstrumentation. Use the Azure Monitor OpenTelemetry Distro instead.
For a complete list of supported autoinstrumentation scenarios, see Supported environments, languages, and resource providers.
Prerequisites
Before you install the Application Insights Agent extension, you need a connection string. Create a new Application Insights resource or copy the connection string from an existing one.
Enable monitoring for virtual machines
You can use the Azure portal or PowerShell to enable monitoring for VMs.
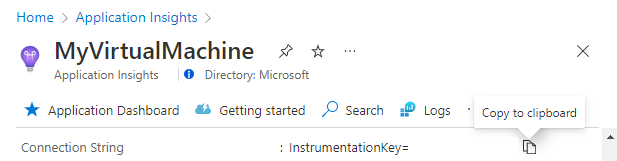
In the Azure portal, go to your Application Insights resource. Copy your connection string to the clipboard.
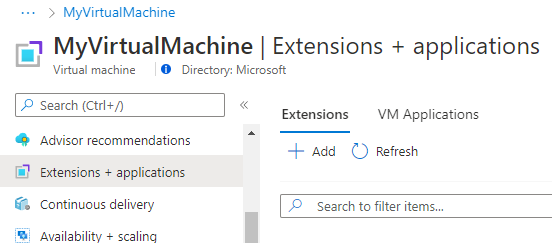
Go to your virtual machine. Under the Settings section in the menu on the left side, select Extensions + applications > Add.
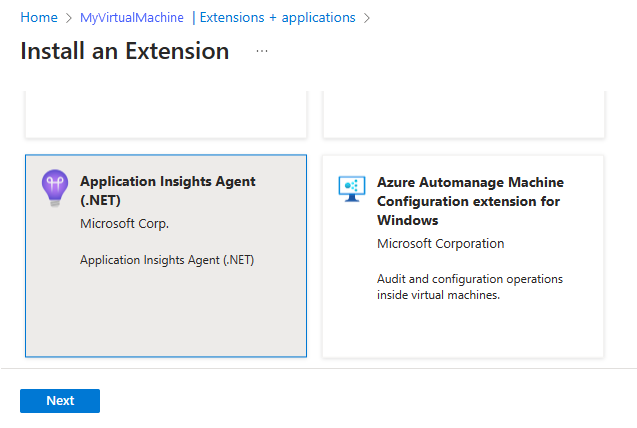
Select Application Insights Agent > Next.
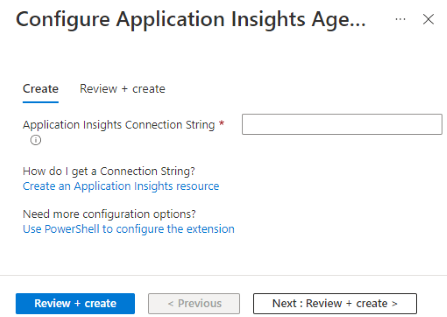
Paste the connection string you copied in step 1 and select Review + create.


Enable monitoring for virtual machine scale sets
You can use the Azure portal or PowerShell to enable monitoring for virtual machine scale sets.
Follow the prior steps for VMs, but go to your virtual machine scale sets instead of your VM.
Frequently asked questions
How can I disable client-side monitoring for ASP.NET Core apps?
Client-side monitoring is enabled by default for ASP.NET Core apps. If you want to disable it, define an environment variable in the server with the following information:
- Name:
APPINSIGHTS_JAVASCRIPT_ENABLED - Value:
false
Troubleshooting
Find troubleshooting tips for the Application Insights Monitoring Agent extension for .NET applications running on Azure virtual machines and virtual machine scale sets.
If you're having trouble deploying the extension, review the execution output that's logged to files found in the following directories:
C:\WindowsAzure\Logs\Plugins\Microsoft.Azure.Diagnostics.ApplicationMonitoringWindows\<version>\
If your extension deployed successfully but you're unable to see telemetry, it could be one of the following issues covered in Agent troubleshooting:
- Conflicting DLLs in an app's bin directory
- Conflict with IIS shared configuration
Test connectivity between your application host and the ingestion service
Application Insights SDKs and agents send telemetry to get ingested as REST calls to our ingestion endpoints. You can test connectivity from your web server or application host machine to the ingestion service endpoints by using raw REST clients from PowerShell or curl commands. See Troubleshoot missing application telemetry in Azure Monitor Application Insights.
Release notes
2.8.44
- Updated Application Insights .NET/.NET Core SDK to 2.20.1 - red field.
- Enabled SQL query collection.
- Enabled support for Microsoft Entra authentication.
2.8.42
Updated Application Insights .NET/.NET Core SDK to 2.18.1 - red field.
2.8.41
Added the ASP.NET Core autoinstrumentation feature.