Exercise 4 - Use MXA to Analyze Audio Glitches
In this lab, you’ll analyze audio glitches. Audio glitches are often caused by one of the following issues:
A Deferred Procedure Call (DPC) or an Interrupt Service Routine (ISR) that runs longer than 1 millisecond.
A driver or kernel thread that runs at dispatch level for 1 millisecond or longer.
Data cannot be read from the disk or the network isn’t fast enough because of high disk or network utilization.
The hardware or software decoder cannot decode and process the stream faster than real-time.
Step 1: Open the trace in MXA and drag the pertinent datasets into panels
Install the Media eXperience Analyzer (MXA) which is part of the Windows ADK.
Right-click on the Start menu and click on Command Prompt (Admin).
Navigate to the folder where you installed MXA.
Set the MXA symbol paths on your PC.
Download AudioGlitches_ThreadsAtDispatchLevel.etl from here.
Open the AudioGlitches_ThreadsAtDispatchLevel.etl trace file by typing the following command:
xa.exe -i <AudioGlitches_ThreadsAtDispatchLevel.etl location>\AudioGlitches_ThreadsAtDispatchLevel.etlFor example, if you downloaded AudioGlitches_ThreadsAtDispatchLevel.etl to C:\Performance\Media, you would type the following command:
xa.exe -i C:\Performance\Media\AudioGlitches_ThreadsAtDispatchLevel.etlOn the MXA splash screen, press the Turn Symbols Off button to turn off symbol lookup.

Once the trace is loaded, close any open panels that appear in the center of the application by pressing the small X next to the name of each panel.
Add 3 new panels. Click View > New Panel or press CTRL+N.
Drag and drop the Audio Glitches Classic dataset under the Media node into the top panel.
Drag and drop the Scheduler dataset under the CPU node into the 2nd panel from the top.
Drag and drop the Sampled Profiles dataset under the CPU node into the 3rd panel from the top.
Filter the idle processes out of the view so that you can see the other thread activity more clearly. In the dataset tree, expand the Scheduler dataset in the CPU node and click the Idle Threads node checkbox twice to deselect it. Clicking the checkbox once highlights the data in the graph; clicking it twice deselects it.
Step 2: Identify the region of the trace where an audio glitch occurred
You can look at the audio engine data from the event trace log (.etl) files to see a visual timeline of when these glitches occurred and compare the timeline to other sets of data to look for patterns.
Zoom in on an audio glitch by clicking and dragging the mouse over one of the bars in the Audio Glitches Classic panel at the top.
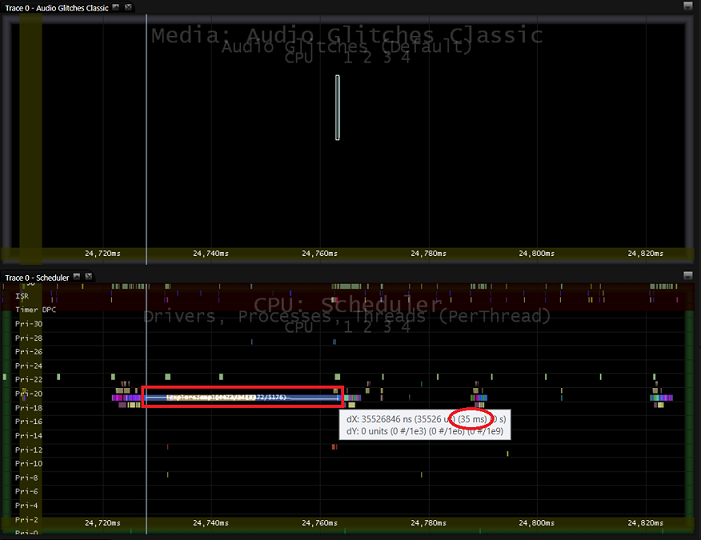
Notice that the iexplore.exe process in the Scheduler dataset in the 2nd panel was running for a long time (~20-35ms) just before the audio glitch.
Press escape to zoom out 100% then repeat the previous two steps to verify the pattern where the iexplore.exe process was running for long durations (~20-35 ms) prior to every audio glitch.
To measure time within the panel, press the SHIFT key while you drag your mouse from one end of the iexplore.exe process bar to the other. The tooltip over the mouse cursor shows you how many milliseconds you are measuring on the timeline. In the MXA screenshot below, the process was running for about 35 milliseconds.

Step 3: Identify the cause of the delays in the pipeline
Before this audio glitch, the long-running iexplore.exe process was running on one of the cores. To find out how the iexplore.exe thread is stalling the audio pipeline, you can look at the corresponding Sampled Profiles dataset in the CPU node.
If the CallStack dataviewer is not visible in the MXA window, click View > Data Viewers > CallStack to open it.
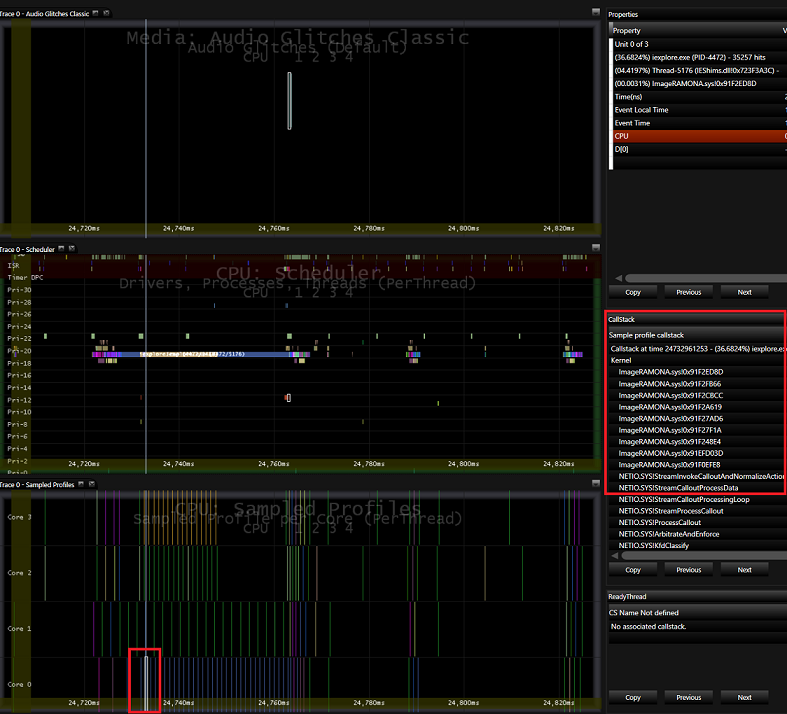
In the Sampled Profiles panel (3rd from the top), hover over the sample profile events that match the same color of the long running iexplore.exe thread.
The CallStack window shows the callstack for each sample. Notice that a specific driver, ImageRAMONA.sys, is at the top of the CallStack when you hover over most of the samples in the core that iexplore.exe is running on.
Although the audiodg.exe thread is running at a higher priority (priority 22) than the iexplore.exe thread (priority 19), the iexplore.exe thread calls into a driver (ImageRAMONA.sys), which raises the IRQL level of the processor. As a result, audiodg.exe, which is waiting on a DPC retained by the dispatcher doesn’t have a chance to run on its regular 10ms cadence, resulting in audio glitches.
Hold down the SHIFT key to freeze the CallStack and Properties Data Viewers and move your mouse to the CallStack. Press Copy.
