Get started with breakpoints in the Visual Studio debugger
Breakpoints are one of the most important debugging techniques in your developer's toolbox. You set breakpoints wherever you want to pause debugger execution. For example, you may want to see the state of code variables or look at the call stack at a certain breakpoint.
Set breakpoints in source code
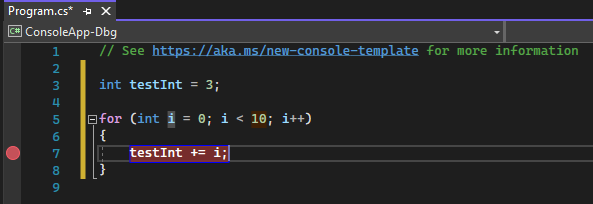
You can set a breakpoint on any line of executable code. For example, take a look at this simple C# code that creates a simple loop.
int testInt = 3;

for (int i = 0; i < 10; i++)
{
    testInt += i;
}
You could set a breakpoint on the line of code with the variable assignment (int testInt = 3), the for loop, or any code inside the for loop. You can't set a breakpoint on method signatures, declarations for a namespace or class, or variable declarations if there's no assignment and no getter/setter.
To set a breakpoint in source code:
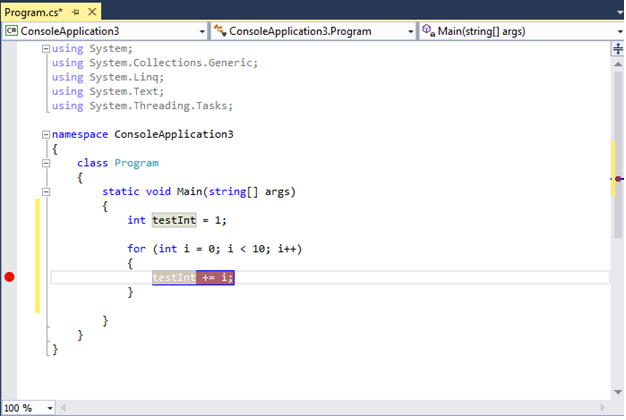
- Click in the far left margin next to a line of code. You can also select the line and press F9, select Debug > Toggle Breakpoint, or right-click and select Breakpoint > Insert breakpoint. The breakpoint appears as a red dot in the left margin.
For most languages (including C#), Visual Studio automatically highlights breakpoint and current execution lines. For some languages, such as C++, which isn't highlighted by default, you can turn on highlighting of breakpoint and current lines by selecting Tools (or Debug) > Options > Debugging > Highlight entire source line for breakpoints and current statement (C++ only).
To debug, press F5 or select Debug > Start Debugging.
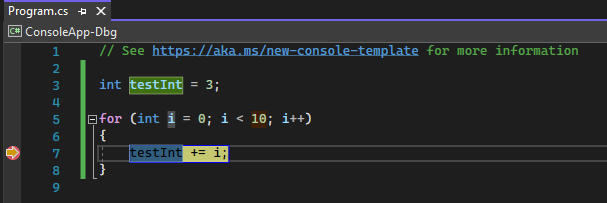
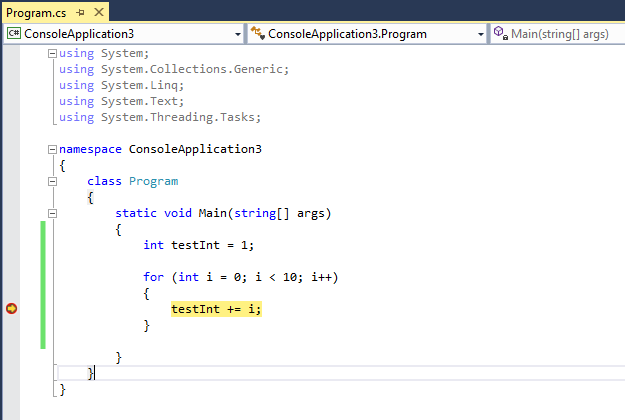
When you debug, execution pauses at the breakpoint, before the code on that line is executed. The breakpoint symbol shows a yellow arrow.
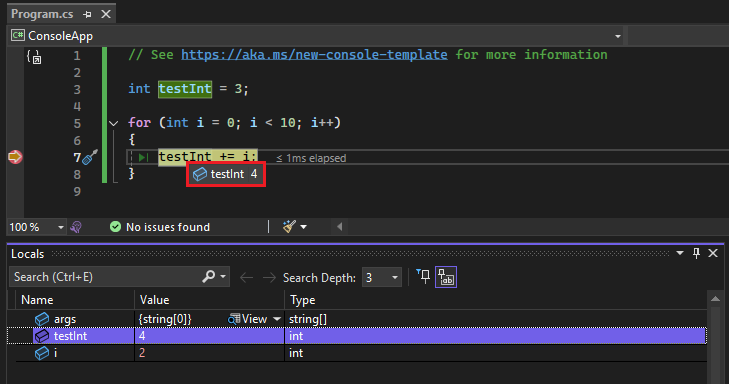
At the breakpoint in the following example, the value of testInt is still 3. So, the value hasn't changed since the variable was initialized (set to a value of 3) because the statement in yellow hasn't yet executed.
At the breakpoint in the following example, the value of testInt is still 1. So, the value hasn't changed since the variable was initialized (set to a value of 1) because the statement in yellow hasn't yet executed.
When the debugger stops at the breakpoint, you can look at the current state of the app, including variable values and the call stack.
For example, in the following illustration, you can see the value of testInt in a data tip and in the Locals window.
Here are a few general instructions for working with breakpoints.
The breakpoint is a toggle. You can click it, press F9, or use Debug > Toggle Breakpoint to delete or reinsert it.
To disable a breakpoint without deleting it, hover over or right-click it, and select Disable breakpoint. Disabled breakpoints appear as empty dots in the left margin or the Breakpoints window. To re-enable a breakpoint, hover over or right-click it, and select Enable breakpoint.
Set conditions and actions, add and edit labels, or export a breakpoint by right-clicking it and selecting the appropriate command, or hovering over it and selecting the Settings icon.
Types of breakpoints
Visual Studio supports different types of breakpoints to support different debugging scenarios, such as conditional breakpoints that only activate based on specified criteria. For more information, see Use the right type of breakpoint.
Manage breakpoints in the Breakpoints window
You can use the Breakpoints window to see and manage all the breakpoints in your solution. This centralized location is especially helpful in a large solution, or for complex debugging scenarios where breakpoints are critical.
In the Breakpoints window, you can search, sort, filter, enable/disable, or delete breakpoints. You can also set conditions and actions, or add a new function or data breakpoint.
To open the Breakpoints window, select Debug > Windows > Breakpoints, or press Ctrl+Alt+B.

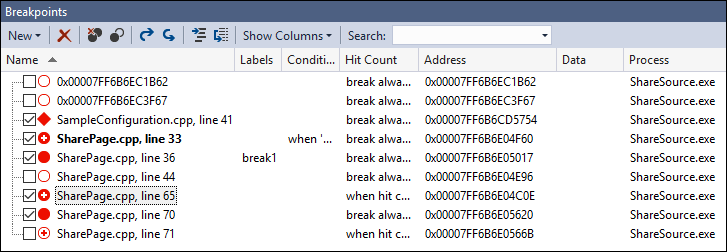
To select the columns to display in the Breakpoints window, select Show Columns. Select a column header to sort the breakpoints list by that column.
Breakpoint labels
You can use labels to sort and filter the list of breakpoints in the Breakpoints window.
- To add a label to a breakpoint, right-click the breakpoint in the source code or the Breakpoints window, and then select Edit labels. Add a new label or choose an existing one, and then select OK.
- Sort the breakpoint list in the Breakpoints window by selecting the Labels, Conditions, or other column headers. You can select the columns to display by selecting Show Columns in the toolbar.
Breakpoint groups
For complex debugging scenarios, you may want to create breakpoint groups to organize your breakpoints. This allows you to quickly enable and disable logical groupings of breakpoints, based upon the current scenario that you're trying to debug.
You can create breakpoints in the Breakpoints window by selecting New > Breakpoint Group, and providing a name for the group. To add a breakpoint to a group, right-click the breakpoint and choose Add to Breakpoint Group > <group name>. Or, drag-and-drop your breakpoints into the desired group.
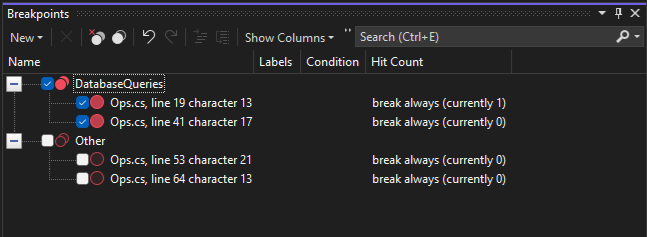
To set a default breakpoint group, right-click a group and select Set as default Breakpoint Group. When you set a default breakpoint group, newly created breakpoints are automatically added to the group.
Export and import breakpoints
To save or share the state and location of your breakpoints, you can export or import them.
Starting in Visual Studio 2022 version 17.12 Preview 3, breakpoint groups are also included with the exported and imported breakpoints.
- To export a single breakpoint to an XML file, right-click the breakpoint in the source code or Breakpoints window, and select Export or Export selected. Select an export location, and then select Save. The default location is the solution folder.
- To export several breakpoints, in the Breakpoints window, select the boxes next to the breakpoints, or enter search criteria in the Search field. Select the Export all breakpoints matching the current search criteria icon, and save the file.
- To export all breakpoints, deselect all boxes and leave the Search field blank. Select the Export all breakpoints matching the current search criteria icon, and save the file.
- To import breakpoints, in the Breakpoints window, select the Import breakpoints from a file icon, navigate to the XML file location, and select Open.
Set breakpoints from debugger windows
You can also set breakpoints from the Call Stack and Disassembly debugger windows.
Set a breakpoint in the Call Stack window
To break at the instruction or line that a calling function returns to, you can set a breakpoint in the Call Stack window.
To set a breakpoint in the Call Stack window:
To open the Call Stack window, you must be paused during debugging. Select Debug > Windows > Call Stack, or press Ctrl+Alt+C.
In the Call Stack window, right-click the calling function and select Breakpoint > Insert Breakpoint, or press F9.
A breakpoint symbol appears next to the function call name in the left margin of the call stack.
The call stack breakpoint appears in the Breakpoints window as an address, with a memory location that corresponds to the next executable instruction in the function.
The debugger breaks at the instruction.
For more information about the call stack, see How to: Use the Call Stack window.
To visually trace breakpoints during code execution, see Map methods on the call stack while debugging.
Set a breakpoint in the Disassembly window
To open the Disassembly window, you must be paused during debugging. Select Debug > Windows > Disassembly, or press Ctrl+Alt+D.
In the Disassembly window, click in the left margin of the instruction you want to break at. You can also select it and press F9, or right-click and select Breakpoint > Insert Breakpoint.