Azure Performance Diagnostics (PerfInsights) VM Extension for Windows
Applies to: ✔️ Windows VMs
Azure Performance Diagnostics VM Extension helps collect performance diagnostic data from Windows VMs. The extension performs analysis, and provides a report of findings and recommendations to identify and resolve performance issues on the virtual machine. This extension installs a troubleshooting tool called PerfInsights.
Note
If you want to run diagnostics on your VM from the Azure portal for non-classic VMs, it is recommended to use the new experience. For more information, see Performance Diagnostics for Azure virtual machines.
Prerequisites
This extension can be installed on:
- Windows Server 2019
- Windows Server 2016
- Windows Server 2012 R2
- Windows Server 2012
- Windows Server 2008 R2
- Windows 10
- Windows 8.1
- Windows 8
Extension schema
The following JSON shows the schema for Azure Performance Diagnostics VM Extension. This extension requires the name and key for a storage account to store the diagnostics output and report. These values are sensitive. Storage account key should be stored inside a protected setting configuration. Azure VM extension protected setting data is encrypted, and it is only decrypted on the target virtual machine. Note that storageAccountName and storageAccountKey are case-sensitive. Other required parameters are listed in the following section.
{
     "name": "[concat(parameters('vmName'),'/AzurePerformanceDiagnostics')]",
     "type": "Microsoft.Compute/virtualMachines/extensions",
     "location": "[parameters('location')]",
     "apiVersion": "2015-06-15",
     "properties": {
       "publisher": "Microsoft.Azure.Performance.Diagnostics",
       "type": "AzurePerformanceDiagnostics",
       "typeHandlerVersion": "1.0",
       "autoUpgradeMinorVersion": true,
       "settings": {
         "storageAccountName": "[parameters('storageAccountName')]",
         "performanceScenario": "[parameters('performanceScenario')]",
         "enableContinuousDiagnostics": "[parameters('enableContinuousDiagnostics')]",
         "traceDurationInSeconds": "[parameter('traceDurationInSeconds')]",
         "perfCounterTrace": "[parameters('perfCounterTrace')]",
         "networkTrace": "[parameters('networkTrace')]",
         "xperfTrace": "[parameters('xperfTrace')]",
         "storPortTrace": "[parameters('storPortTrace')]",
         "requestTimeUtc":  "[parameters('requestTimeUtc')]",
         "resourceId": "[resourceId('Microsoft.Compute/virtualMachines', parameters('vmName'))]"
       },
       "protectedSettings": {
           "storageAccountKey": "[parameters('storageAccountKey')]"
       }
     }
   }
Property values
| Name | Value / Example | Description |
|---|---|---|
| apiVersion | 2015-06-15 | The version of the API. |
| publisher | Microsoft.Azure.Performance.Diagnostics | The publisher namespace for the extension. |
| type | AzurePerformanceDiagnostics | The type of the VM extension. |
| typeHandlerVersion | 1.0 | The version of the extension handler. |
| performanceScenario | basic | The performance scenario for which to capture data. Valid values are: basic, vmslow, azurefiles, and custom. |
| enableContinuousDiagnostics | True | Enable continuous diagnostics. Valid values are true or false. To enable Continuous Performance Diagnostics, you need to provide this property. |
| traceDurationInSeconds | 300 | The duration of the traces, if any of the trace options are selected. |
| perfCounterTrace | p | Option to enable Performance Counter Trace. Valid values are p or empty value. If you do not want to capture this trace, leave the value as empty. |
| networkTrace | n | Option to enable Network Trace. Valid values are n or empty value. If you do not want to capture this trace, leave the value as empty. |
| xperfTrace | x | Option to enable XPerf Trace. Valid values are x or empty value. If you do not want to capture this trace, leave the value as empty. |
| storPortTrace | s | Option to enable StorPort Trace. Valid values are s or empty value. If you do not want to capture this trace, leave the value as empty. |
| srNumber | 123452016365929 | The support ticket number, if available. Leave the value as empty if you don't have it. |
| requestTimeUtc | 2017-09-28T22:08:53.736Z | Current Date Time in Utc. If you are using the portal to install this extension, you do not need to provide this value. |
| resourceId | /subscriptions/{subscriptionId}/resourceGroups/{resourceGroupName}/providers/{resourceProviderNamespace}/{resourceType}/{resourceName} | The unique identifier of a VM. |
| storageAccountName | mystorageaccount | The name of the storage account to store the diagnostics logs and results. |
| storageAccountKey | lDuVvxuZB28NNP…hAiRF3voADxLBTcc== | The key for the storage account. |
Install the extension
Note
We recommend installing the extension through the performance diagnostics blade, as describe in Install and run performance diagnostics on your VM.
Follow these instructions to install the extension on Windows virtual machines:
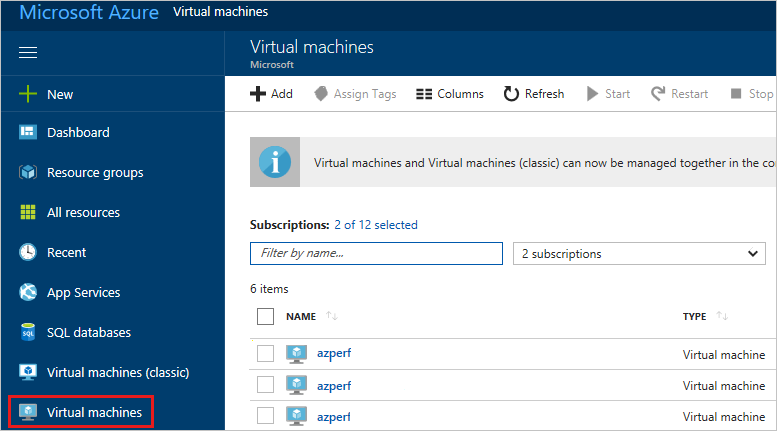
Sign in to the Azure portal.
Select the virtual machine where you want to install this extension.
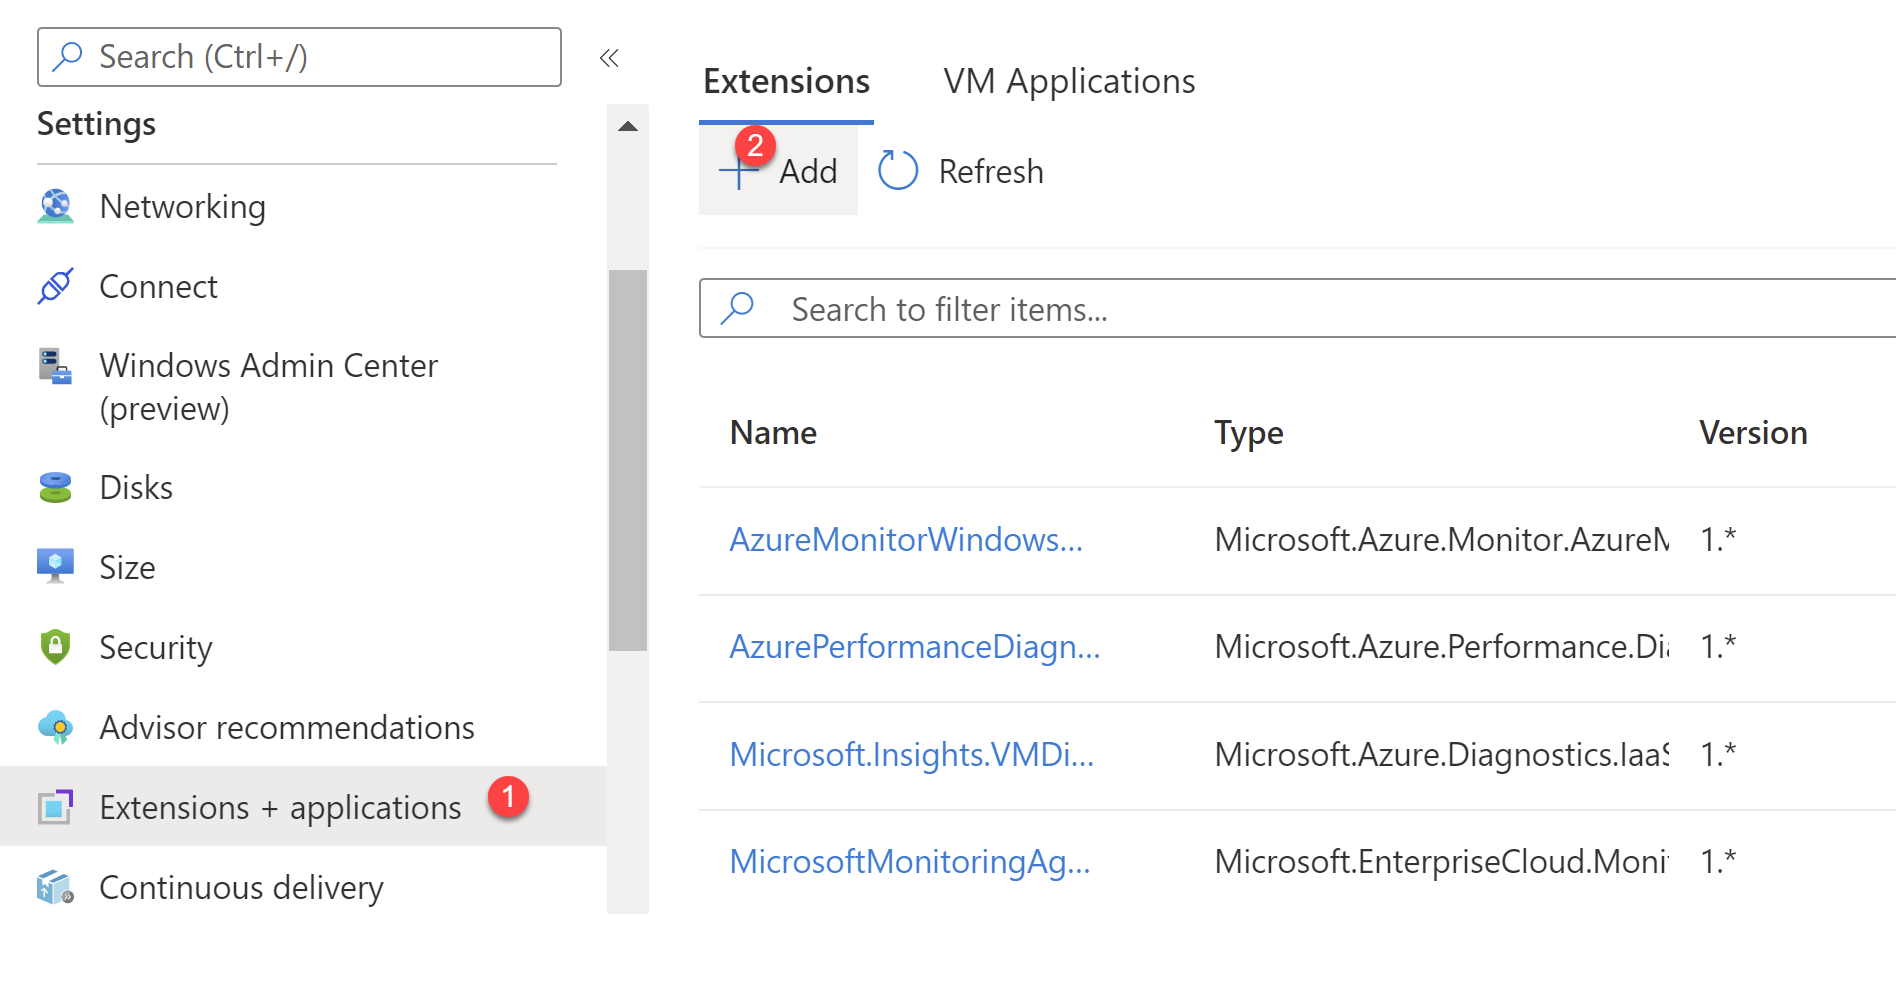
Select the Extensions + applications blade, and select Add.
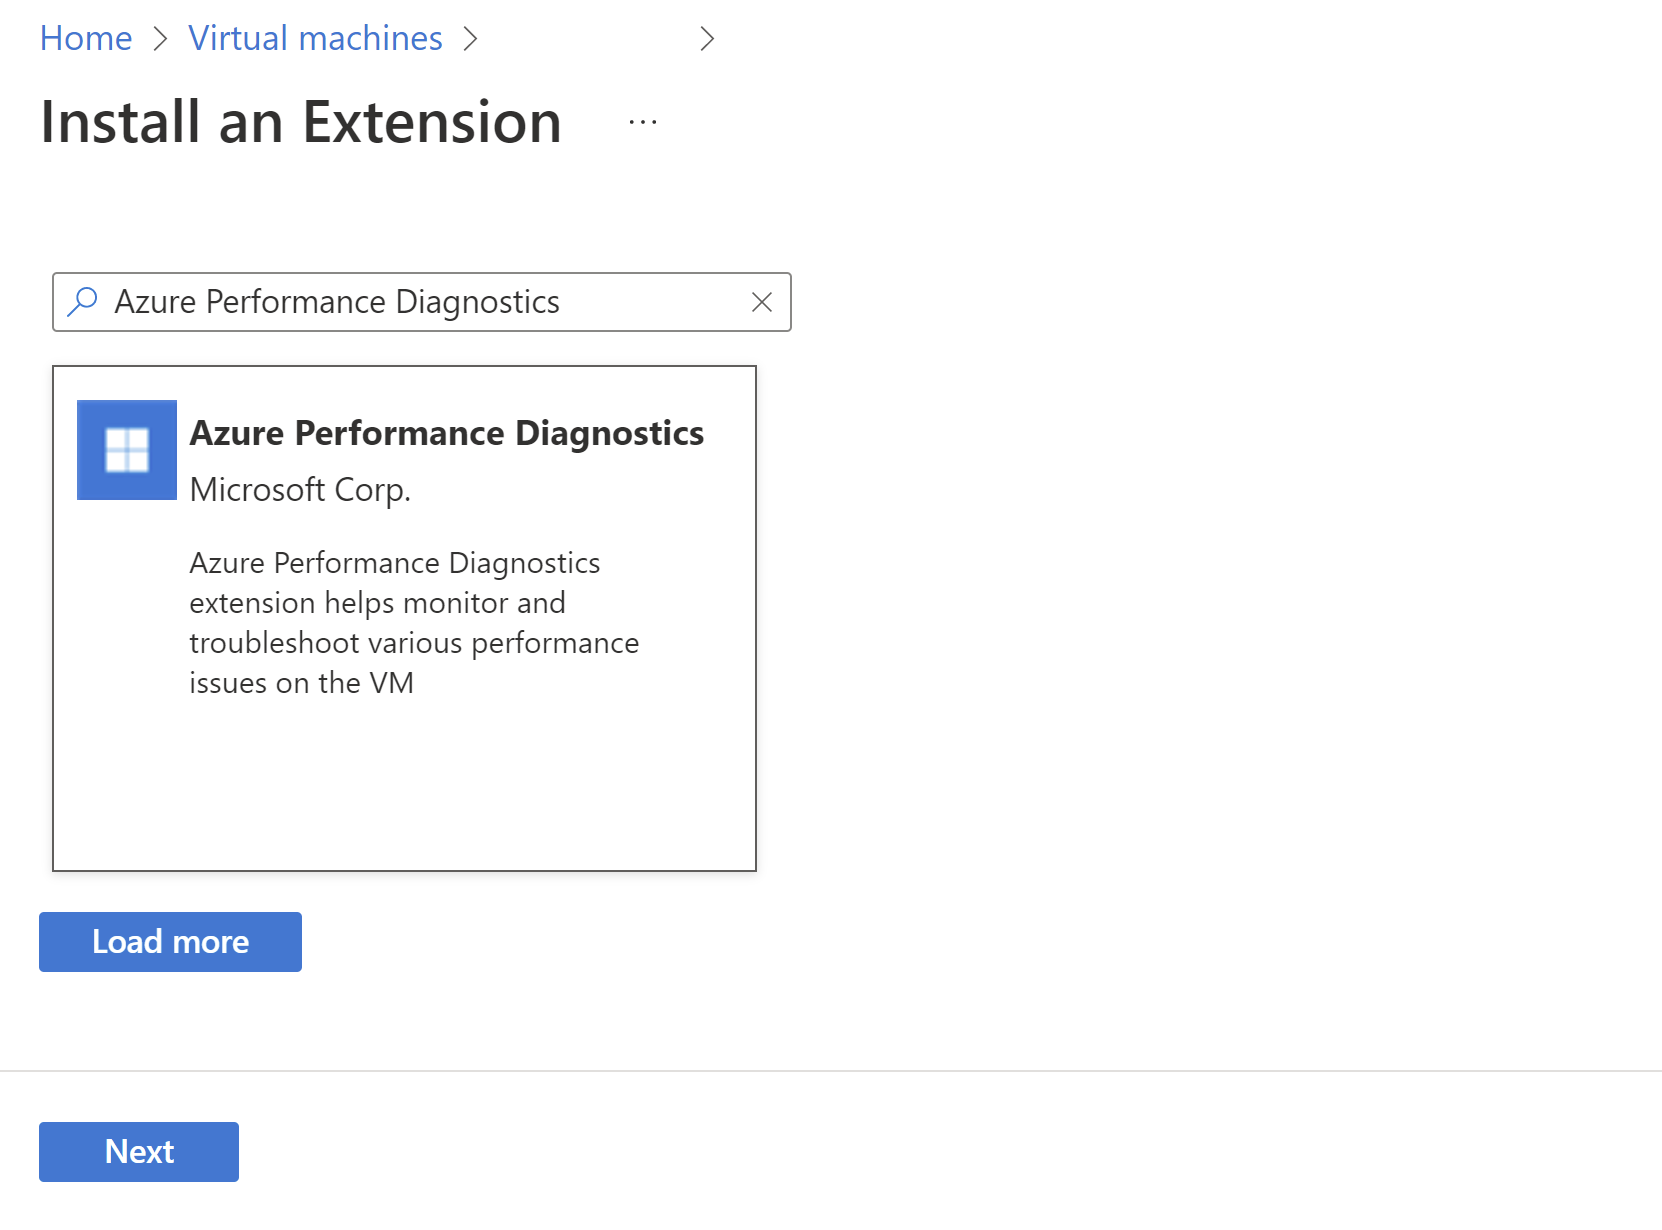
Search for Azure Performance Diagnostics, click the extension, review the terms and conditions, and select Next.
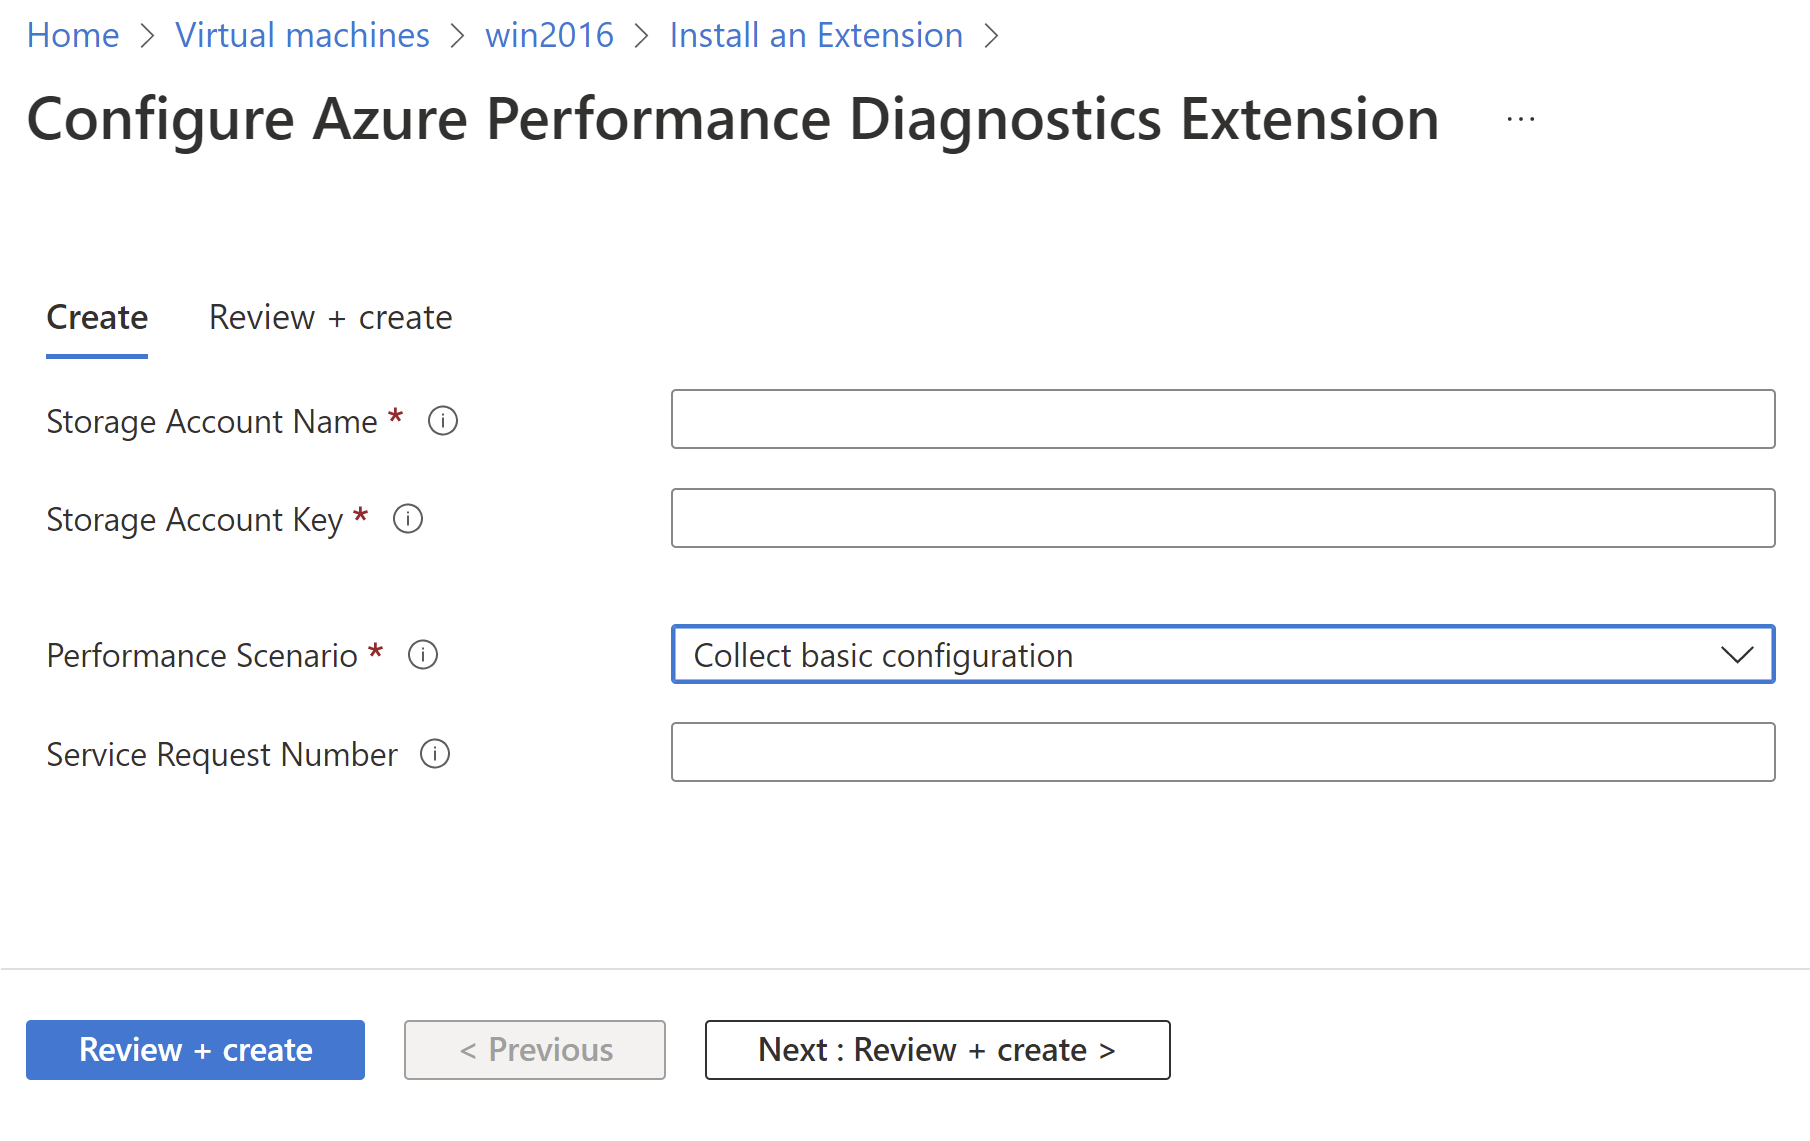
Provide the parameter values for the installation, and then install the extension. For more information about supported scenarios, see How to use PerfInsights.
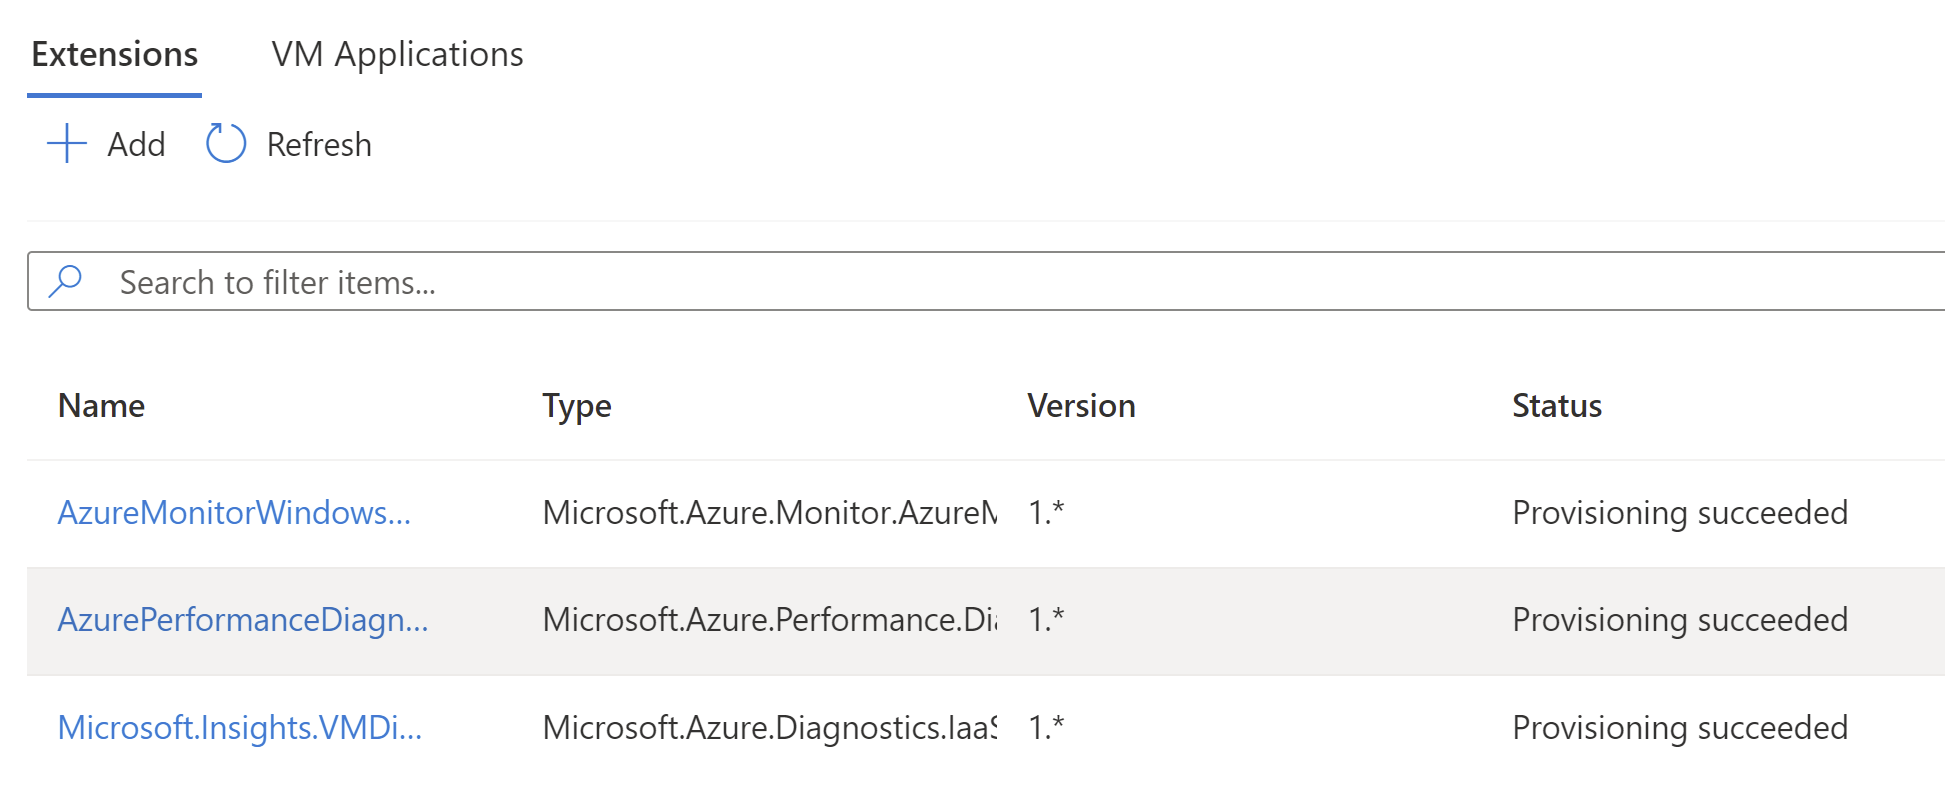
When the installation is successful, the status of the extension shows Provisioning succeeded.
Note
The extension runs when the provisioning has succeeded. It takes two minutes or less to complete for the basic scenario. For other scenarios, it runs through the duration specified during the installation.
Remove the extension
Note
We recommend uninstalling the extension through the performance diagnostics blade, as describe in Uninstall performance diagnostics.
To remove the extension from a virtual machine, follow these steps:
Sign in to the Azure portal, select the virtual machine from which you want to remove this extension, and then select the Extensions + applications blade.
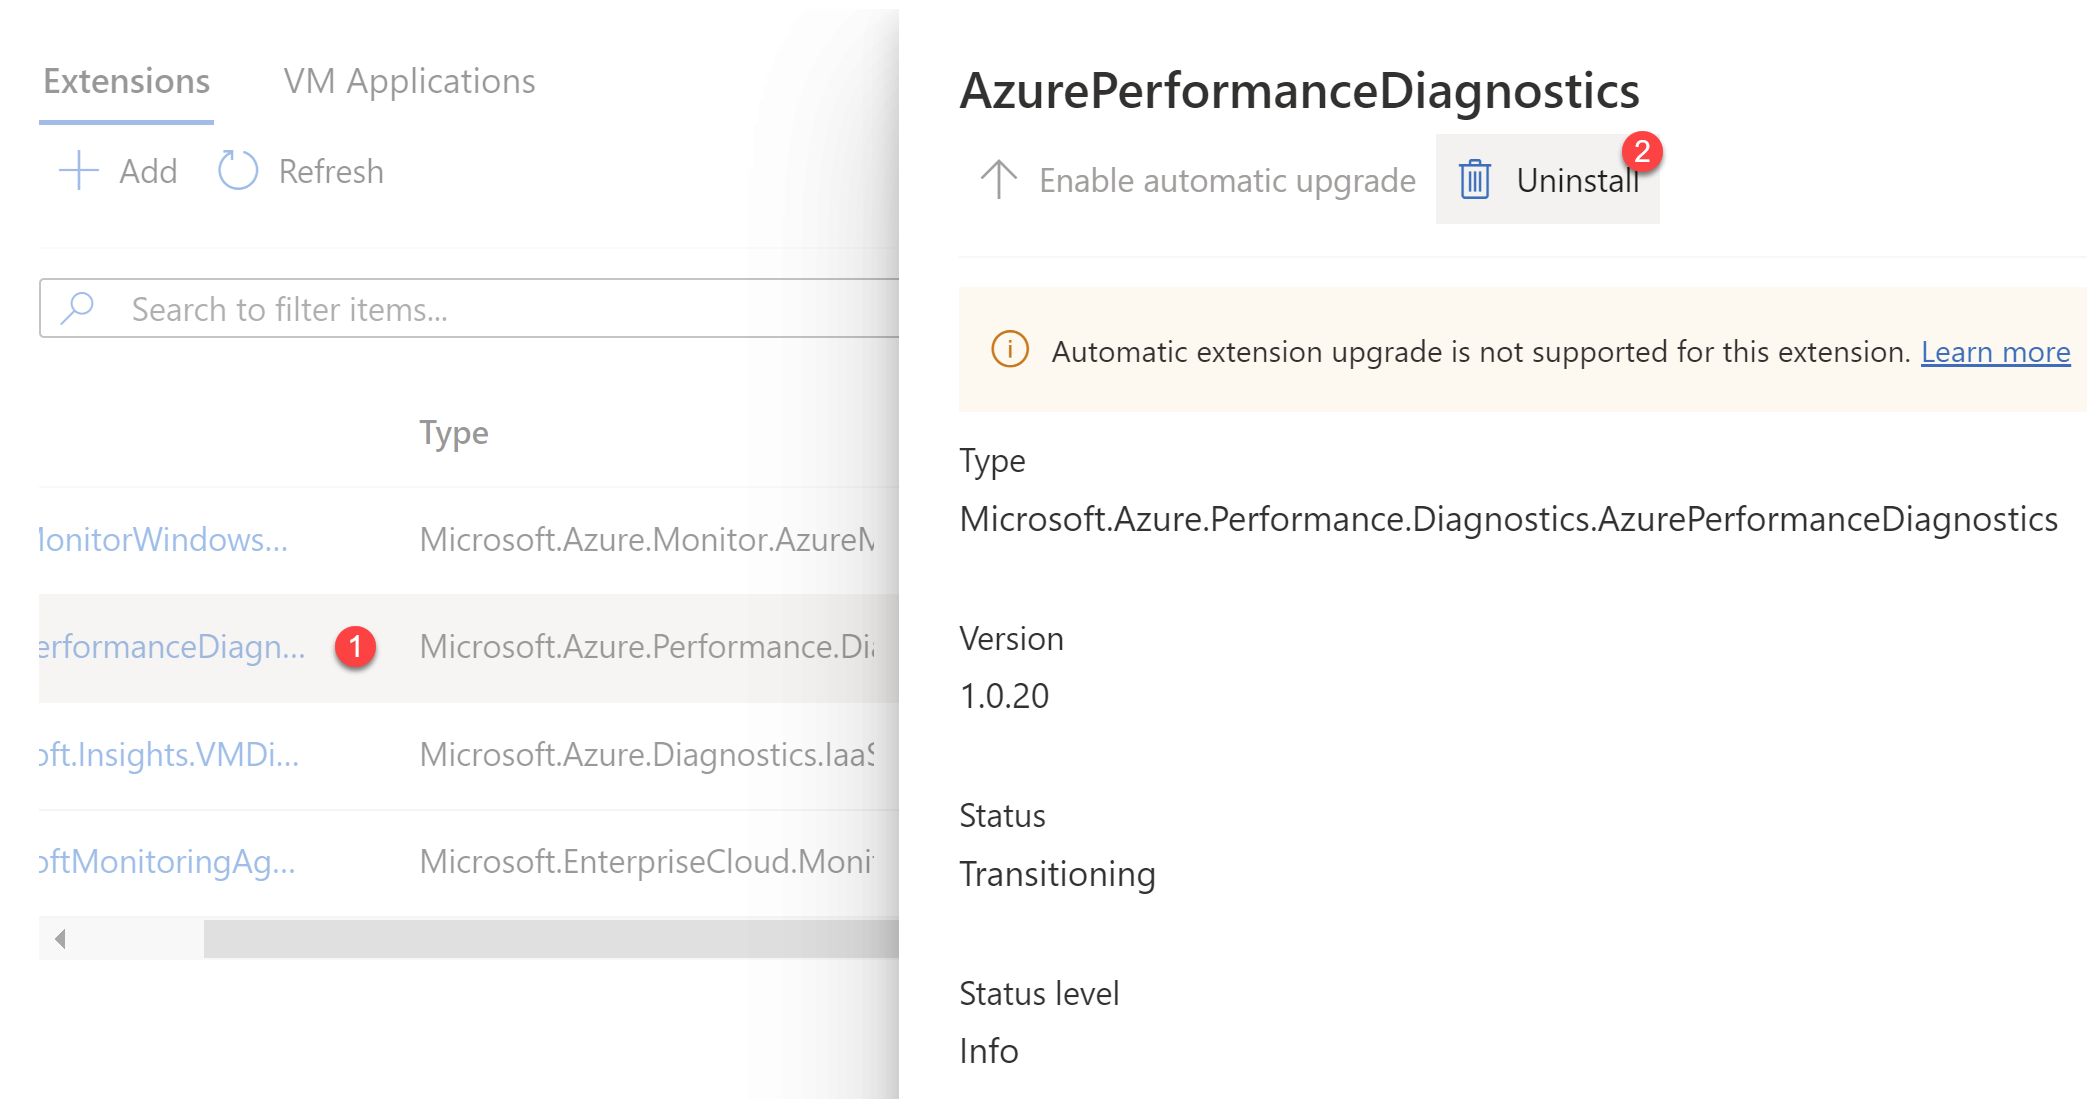
Select the Performance Diagnostics Extension, and then select Uninstall.
Template deployment
Azure virtual machine extensions can be deployed with Azure Resource Manager templates. The JSON schema detailed in the previous section can be used in an Azure Resource Manager template. This runs the Azure Performance Diagnostics VM extension during an Azure Resource Manager template deployment. Here is a sample template:
{
 "$schema": "https://schema.management.azure.com/schemas/2015-01-01/deploymentTemplate.json#",
 "contentVersion": "1.0.0.0",
 "parameters": {
   "vmName": {
     "type": "string",
     "defaultValue": "yourVMName"
   },
   "location": {
     "type": "string",
     "defaultValue": "southcentralus"
   },
   "storageAccountName": {
     "type": "securestring",
     "defaultValue": "yourStorageAccount"
   },
   "storageAccountKey": {
     "type": "securestring",
     "defaultValue": "yourStorageAccountKey"
   },
   "performanceScenario": {
     "type": "string",
     "defaultValue": "basic"
   },

"enableContinuousDiagnostics": {
     "type": "boolean",
     "defaultValue": "false"
  },
  "traceDurationInSeconds": {
   "type": "int",
   "defaultValue": 300
 },
   "perfCounterTrace": {
     "type": "string",
     "defaultValue": "p"
   },
   "networkTrace": {
     "type": "string",
     "defaultValue": ""
   },
   "xperfTrace": {
     "type": "string",
     "defaultValue": ""
   },
   "storPortTrace": {
     "type": "string",
     "defaultValue": ""
   },
   "requestTimeUtc": {
     "type": "string",
     "defaultValue": "10/2/2017 11:06:00 PM"
   }
 },
 "resources": [
   {
     "name": "[concat(parameters('vmName'),'/AzurePerformanceDiagnostics')]",
     "type": "Microsoft.Compute/virtualMachines/extensions",
     "location": "[parameters('location')]",
     "apiVersion": "2015-06-15",
     "properties": {
       "publisher": "Microsoft.Azure.Performance.Diagnostics",
       "type": "AzurePerformanceDiagnostics",
       "typeHandlerVersion": "1.0",
       "autoUpgradeMinorVersion": true,
       "settings": {
         "storageAccountName": "[parameters('storageAccountName')]",
         "performanceScenario": "[parameters('performanceScenario')]",
"enableContinuousDiagnostics" : "[parameters('enableContinuousDiagnostics')]",
         "traceDurationInSeconds": "[parameters('traceDurationInSeconds')]",
         "perfCounterTrace": "[parameters('perfCounterTrace')]",
         "networkTrace": "[parameters('networkTrace')]",
         "xperfTrace": "[parameters('xperfTrace')]",
         "storPortTrace": "[parameters('storPortTrace')]",
         "requestTimeUtc":  "[parameters('requestTimeUtc')]",
         "resourceId": "[resourceId('Microsoft.Compute/virtualMachines', parameters('vmName'))]"
       },
       "protectedSettings": {
           "storageAccountKey": "[parameters('storageAccountKey')]"
       }
     }
   }
 ]
}
PowerShell deployment
Use the Set-AzVMExtension command to deploy Azure Performance Diagnostics VM Extension to an existing virtual machine:
$PublicSettings = @{ "storageAccountName"="mystorageaccount";"performanceScenario"="basic"; "enableContinuousDiagnostics" : $False;"traceDurationInSeconds"=300;"perfCounterTrace"="p";"networkTrace"="";"xperfTrace"="";"storPortTrace"="";"srNumber"="";"requestTimeUtc"="2017-09-28T22:08:53.736Z";"resourceId"="VMResourceId" }
$ProtectedSettings = @{"storageAccountKey"="mystoragekey" }

Set-AzVMExtension -ExtensionName "AzurePerformanceDiagnostics" -ResourceGroupName "myResourceGroup" -VMName "myVM" -Publisher "Microsoft.Azure.Performance.Diagnostics" -ExtensionType "AzurePerformanceDiagnostics" -TypeHandlerVersion 1.0 -Settings $PublicSettings -ProtectedSettings $ProtectedSettings -Location WestUS
Information on the data captured
The PerfInsights tool collects various logs, configuration, and diagnostic data, depending on the selected scenario. For more information, see the PerfInsights documentation.
View and share the results
Output from the extension can be found in a zip file that uploaded to the storage account specified during the installation and is shared for 30 days by using Shared Access Signatures (SAS). This zip file contains diagnostic logs and a report with findings and recommendations. A SAS link to the output zip file can be found inside a text file named zipfilename_saslink.txt under the folder C:\Packages\Plugins\Microsoft.Azure.Performance.Diagnostics.AzurePerformanceDiagnostics\<version>. Anyone who has this link is able to download the zip file.
To assist the support engineer working on your support ticket, Microsoft might use this SAS link to download the diagnostics data.
To view the report, extract the zip file and open the PerfInsights Report.html file.
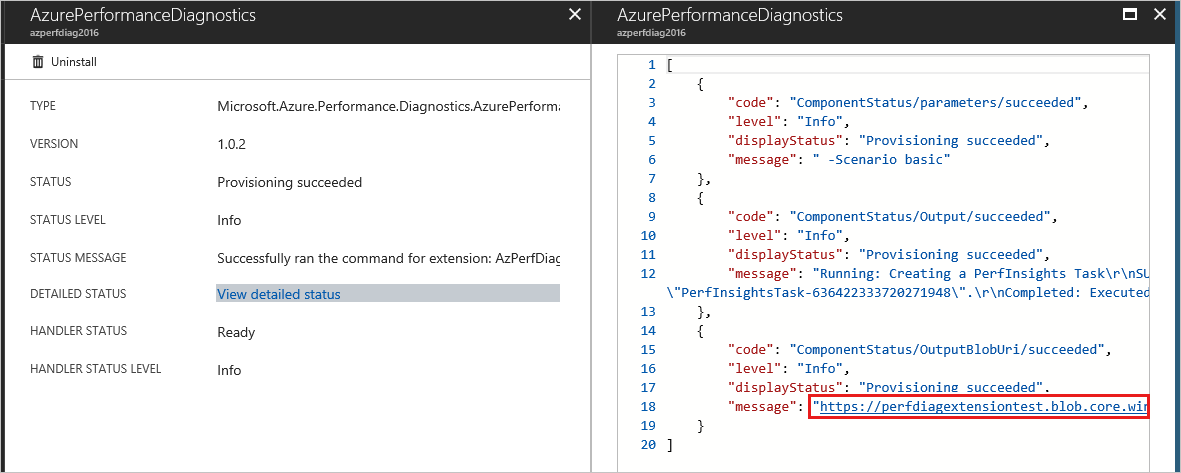
You should also be able to download the zip file directly from the portal by selecting the extension.
Note
The SAS link displayed in the portal might not work sometimes. This can be caused by a malformed URL during the encoding and decoding operations. You can instead get the link directly from the *_saslink.txt file from the VM.
Troubleshoot and support
Extension deployment status (in the notification area) might show "Deployment in progress" even though the extension is successfully provisioned.
This issue can be safely ignored, as long as the extension status indicates that the extension is successfully provisioned.
You can address some issues during installation by using the extension logs. Extension execution output is logged to files found in the following directory:
C:\WindowsAzure\Logs\Plugins\Microsoft.Azure.Performance.Diagnostics.AzurePerformanceDiagnostics\<version>If you see the following errors in the Azure portal or Performance Diagnostics extension logs (AzPerfDiagExtension.log or PerfInsights.log), this usually means the HTTPS certificate chain is broken:
-
Provisioning Failed - message: Failed to upload the PerfInsights result to Azure storage account.
-
PerfInsights process exited with code 1700.
-
Could not establish trust relationship for the SSL/TLS secure channel. The remote certificate is invalid according to the validation procedure.
To resolve the errors, ensure that you don't have a Network Security Group (NSG) blocking access to the Certificate Authority URLs described in this list. Or ensure that you don't have any SSL inspection tool in your Network Virtual Appliance or firewall.
-
Contact us for help
If you have questions or need help, create a support request, or ask Azure community support. You can also submit product feedback to Azure feedback community.