View and compare your load test runs
Azure Test Plans
Note
While Azure DevOps cloud-based load testing service is deprecated, Azure Load Testing Preview is available. Azure Load Testing Preview is a fully managed load testing service that enables you to use existing Apache JMeter scripts to generate high-scale load. To learn more, see What is Azure Load Testing Preview?. To learn more about the deprecation of Azure DevOps load testing and other, alternative services see Changes to load test functionality in Visual Studio and cloud load testing in Azure DevOps.
You can review past load test runs or current runs started by anyone on your team, at any time. You can also compare two test runs to see the gain or loss in performance, and other information.
Note
You can open load tests in Visual Studio to analyse and compare results. See How to: Access Load Test Results for Analysis and How to: Create Load Test Performance Reports Using Microsoft Excel.
Open a load test in Azure DevOps
If you are running URL-based or Apache JMeter load tests, you can see the list of all the test runs in the Load test list.

Filter and select a load test
Filter the list of load tests by state, date, or user who created the test run.

Select a test run and open the shortcut menu (in Azure DevOps you can use the
 icon) to see details of the test run, or stop a running test.
You can also open a test run by double-clicking it with your mouse.
Compare two test runs
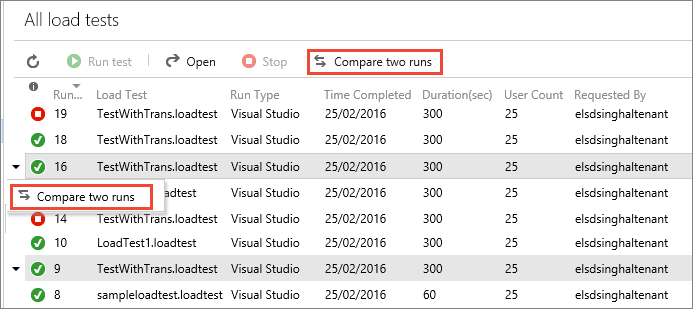
To compare two test runs, select them in the list by holding CTRL while clicking with the mouse. Then choose the Compare two runs icon on the toolbar, or open the shortcut menu for one of the test runs and choose Compare.

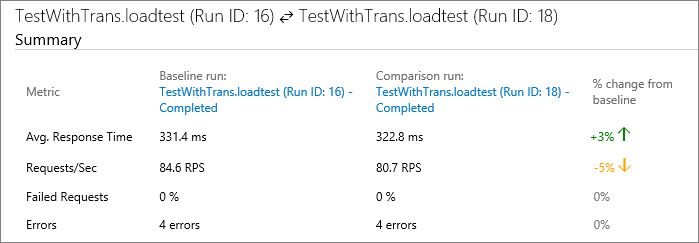
In the comparison page you see the names of the two tests and, at the top of the page, a Summary section that lists the prime performance factors for each test, then the difference from the baseline as a percentage (the color of this text indicates a gain or loss in performance).

Use the links in the first row, the names and IDs of the test runs, to open the detailed view of that test run.
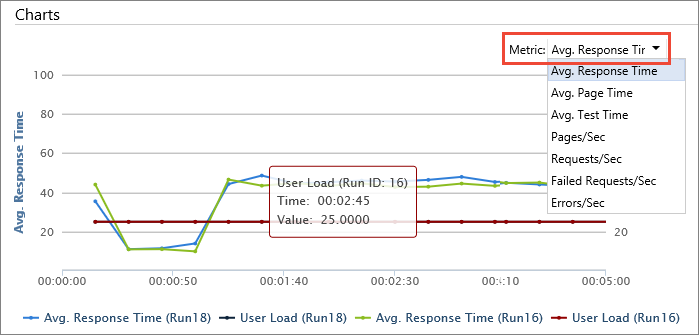
The Charts section of the page shows a graphical comparison of performance for the two test runs. The default is a chart for the response time and user load. Choose a different pair of factors from the dropdown menu to see more performance comparisons.

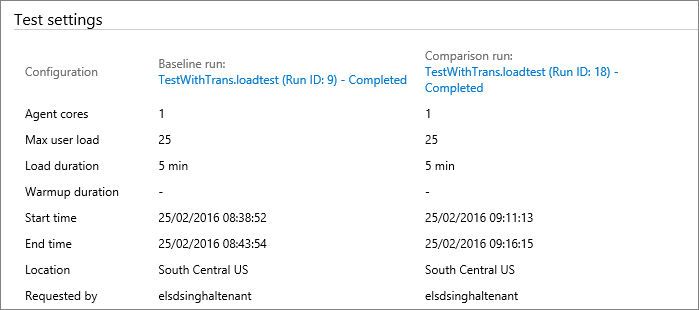
The Test settings section lists the primary settings specified for the two test runs. Again, the names and IDs of the tests are hyperlinks that open the details of that test.
