View Microsoft Edge extensions analytics dashboard
Microsoft announced the launch of the Extensions Analytics Dashboard on September 8, 2021. For more information, see the Track your add-on's performance: extension analytics now available on Partner center blog post.
You can view extension metrics from your Partner Center dashboard and evaluate an extension's performance from Microsoft Edge Add-ons.
For example, you can identify regions in which the number of installations for your extension has increased in the past three months. You can also export this report as a CSV file.
Follow these steps to view your extension's analytics dashboard:
Go to your Partner Center account and select an extension.
From the left panel, click Extension overview > Analytics to view your extension metrics.
Analytics dashboard metrics
From the analytics dashboard you can view metrics for the Last month, 3 months, 6 months, or All time (the period since your extension has been published to the Microsoft Edge Add-ons store).
Weekly users
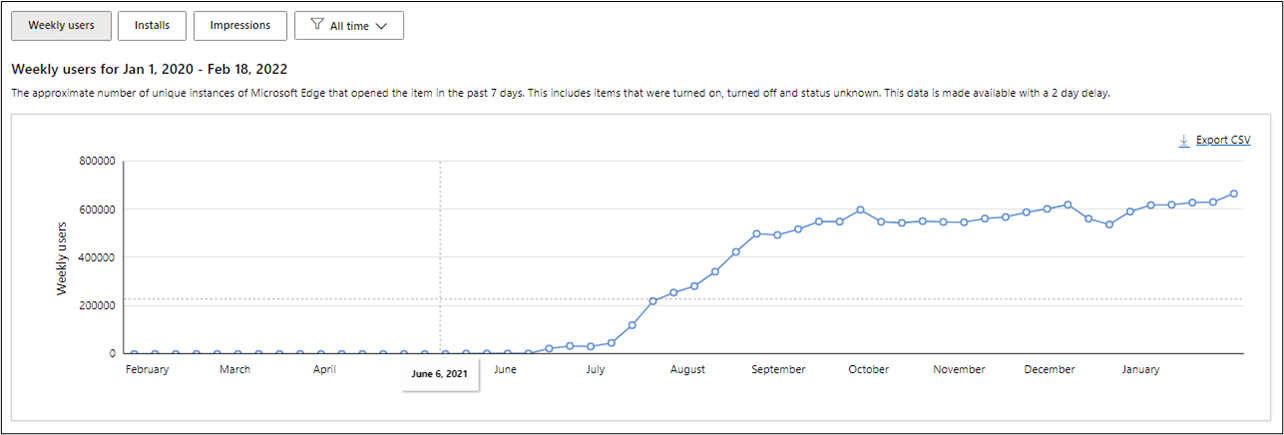
The Weekly users metric tracks the number of users that have your extension turned on, turned off and status unknown on Microsoft Edge over the past seven days.
The following screenshot shows the Weekly users from the date the extension was published until the day the report was run on February 18.
Enabled vs Disabled
The Enabled vs Disabled report shows the number of instances of the extension that are enabled or disabled per user.
The following screenshot shows the Weekly users who have enabled and disabled the extension over the same period. You can choose from Select all / Unselect all, Disabled, and Enabled views.

Installs
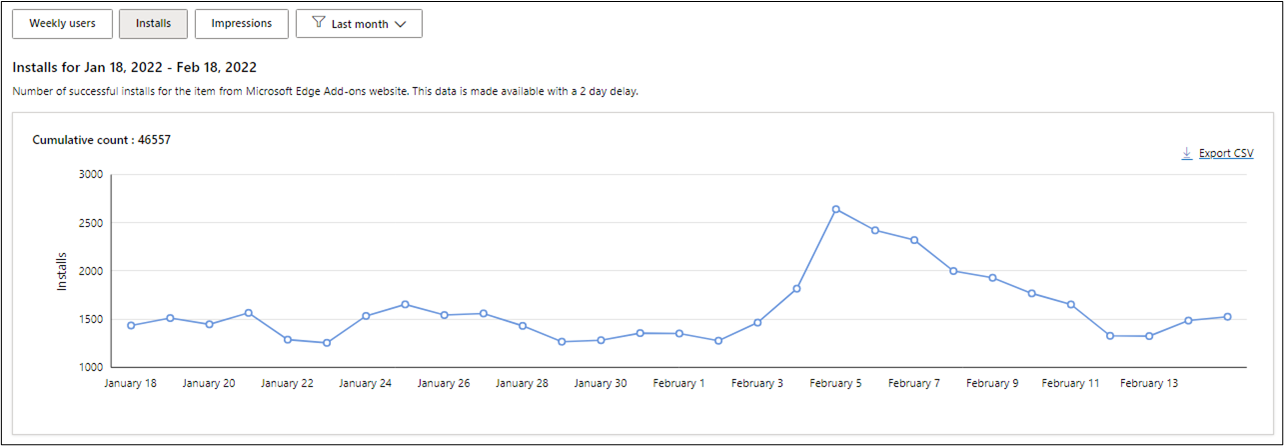
The Installs metric displays the total number of successful installs of your extensions per day from the Microsoft Edge Add-ons store.
The following screenshot shows daily successful installations for the last month.
Impressions
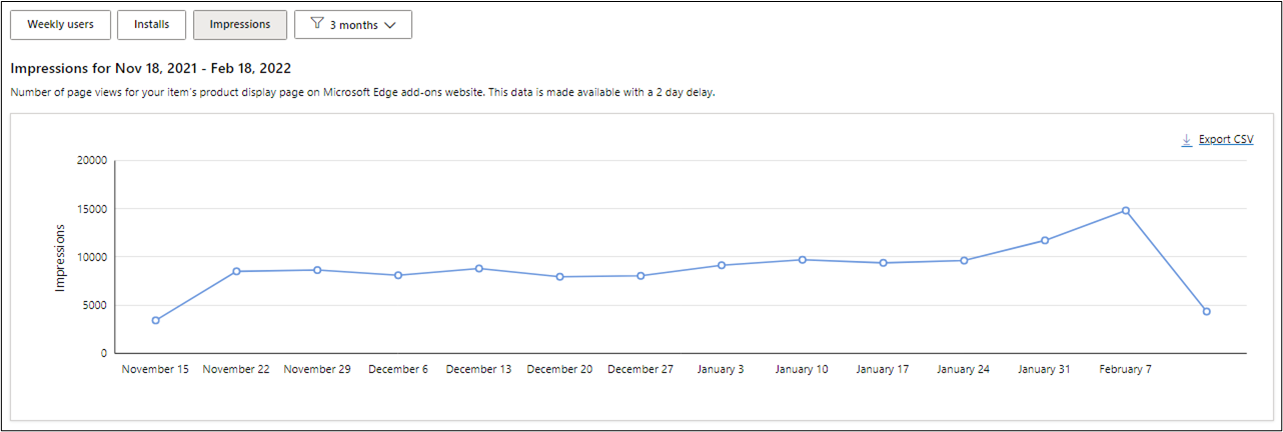
The Impressions metric captures the total number of page views and user visits to your extension product page on Microsoft Edge Add-ons store. The data points are based on weekly or daily totals depending on the selected time range.
The following screenshot shows Impressions for an extension page over a three month period.
Refine by Region, OS, and Language
You can further refine views of your extension's Weekly users, Installs, and Impressions by Region, OS, and Language.
Region
The Region filter covers the geographical distribution of users for your extension, indicating the user base in each region.
The following screenshot shows total user visits.

OS
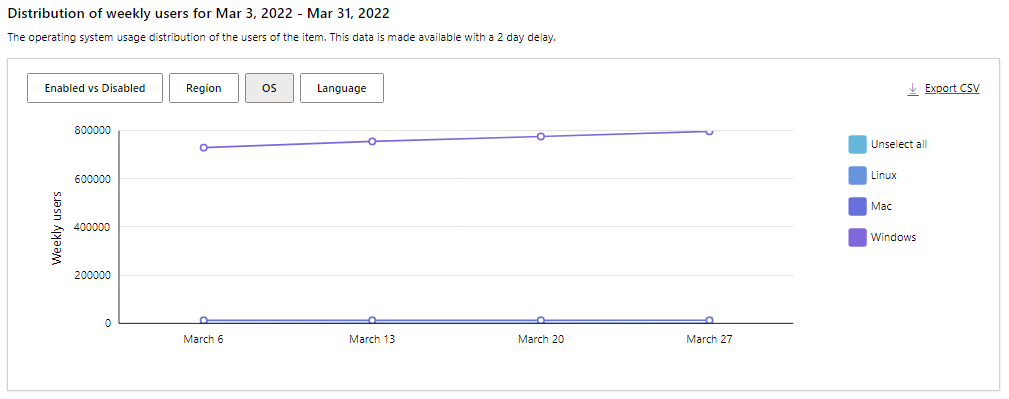
The OS (operating system) filter highlights the OS usage distribution of all the install requests for your extension.
The following screenshot shows Weekly Users by Operating System over 30 days.
Language
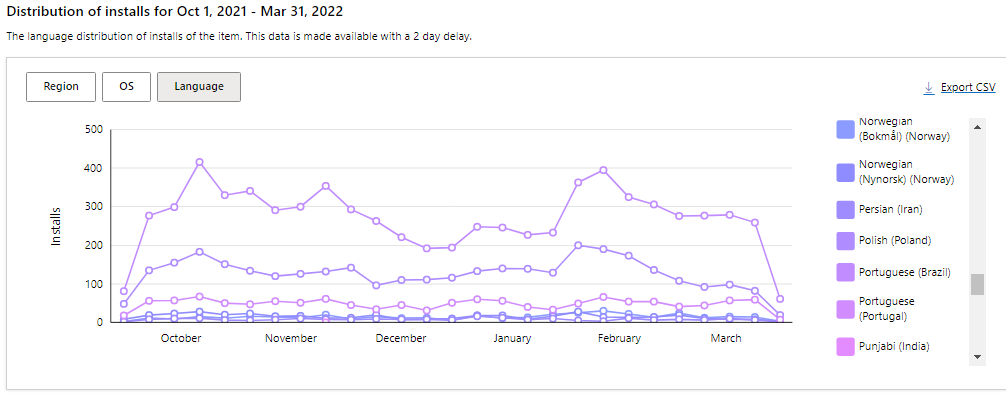
The Language filter shows the language distribution for users of your extension.
The following screenshot shows Installs per Language over a six month period.
The Analytics Dashboard helps you better understand and engage with your extension users. For information about other features launched on Partner Center, see Released features for Microsoft Edge Add-ons - Microsoft Edge Developer documentation | Microsoft Docs.
Share your feedback, questions, and comments with the team on Twitter @MSEdgeDev or via the Microsoft Edge Insider forums on TechCommunity.