Overview of Microsoft Graph Data Connect
In a hybrid workplace, organizations must develop a data-driven culture to evolve dynamically. Today's organizations have an incredible amount of business data across applications and services in Microsoft 365.
The potential this data holds is powerful; however, to remain competitive, organizations must unlock access to their Microsoft 365 data and streamline their manual analytical processes. Data is an organization's competitive advantage.
You can use Microsoft Graph Data Connect to access your Microsoft 365 data for enterprise analytics. Data Connect provides secure, scalable access to relevant Microsoft 365 datasets in Microsoft Fabric, Azure Synapse, and Azure Data Factory.
Data Connect unlocks several enterprise analytics scenarios, including:
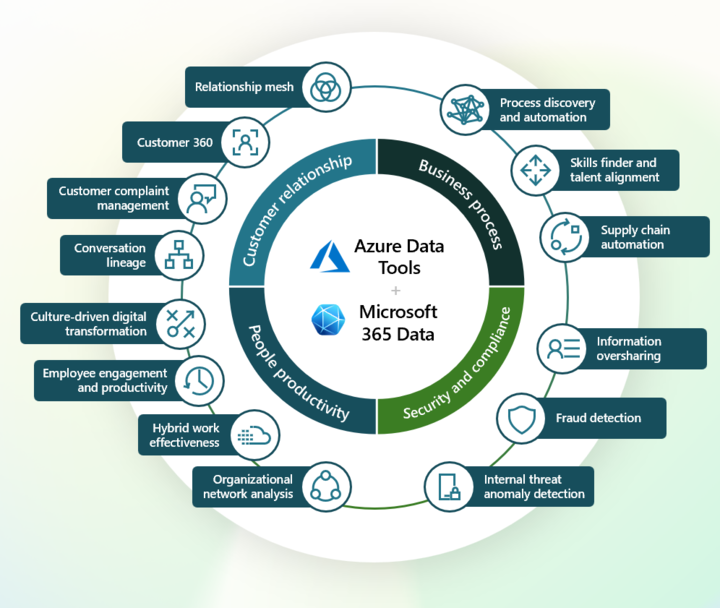
- Customer relationship analytics - For commercial business leaders, go beyond traditional customer relationship management (CRM) insights and understand customer interactions and relationships based on communication and collaboration patterns. Customer relationship scenarios include customer relationship mesh, customer 360, customer complaint management, and conversation lineage.
- Business process analytics - For better operations, see how work flows through the organization on a day-to-day basis. Pinpoint manual processes and workflow bottlenecks that can be automated or optimized. Business process scenarios include process discovery and automation, skills finder and talent alignment, and supply chain automation.
- Security and compliance analytics - To secure sensitive data, learn how employees use and share sensitive information. Implement anomaly detection, threat intelligence, audit log analysis, risk management, and legal forensics. Security and compliance scenarios include information sharing, fraud detection, and international threat detection.
- People productivity analytics - To drive transformation, export your Microsoft Viva productivity metrics, so you can convert insights into solutions with digital adoption, smart meetings and content, hybrid workplaces, and cultural change. People productivity scenarios include culture-driven digital transformation, employee engagement and activity, hybrid work effectiveness, and organizational network analysis.
Why choose Microsoft Graph Data Connect?
With Data Connect, organizations can:
- Scale access to Microsoft 365 data: Gain deep insights into the patterns of organizational collaboration.
- Accelerate time to insights: Reduce the time to value and get updated reports out faster, and perform interactive analysis without data migration.
- Help to ensure security and governance: Minimize compliance management overhead and provide access to secure data, empowering data and business users to make more informed and accurate data-driven decisions.
To learn more about Data Connect features, see Scale access to Microsoft 365 data with Microsoft Graph Data Connect.
Who benefits from Microsoft Graph Data Connect?
Data Connect benefits many roles in your organization:
- LOB business leaders need actionable insights from Microsoft 365 data because it helps them make informed decisions regarding their organization. By analyzing data, they can identify patterns and trends, including customer relationship analytics, business process analytics, security and compliance analytics, and people productivity analytics.
- Data engineers collect, process, and transform Microsoft 365 data from Data Connect into a format that data scientists and analysts can use. They construct and manage Microsoft 365 data pipelines as data combined across other data sources in Microsoft Fabric and ensure the highest levels of data quality and consistency.
- Data scientists and data analysts play a critical role in helping business leaders make sense of their data and use it to drive business decisions. Data analysts identify trends, patterns, and insights. They analyze Microsoft 365 data and create reports, dashboards, and visualizations to communicate findings and make informed decisions. Data scientists build accurate, predictive models and algorithms based on the petabytes of Microsoft 365 data available from Data Connect. They use machine learning to analyze data and make predictions about future outcomes.
How do I get started?
At a high level, to set up Data Connect, you:
- Set up your Microsoft 365 tenant and enable Microsoft Graph Data Connect.
- Set up your Microsoft Entra app registration.
- Set up your Azure Storage resource.
- Set up your Azure resource with Microsoft Fabric, Azure Synapse, or Azure Data Factory.
- Monitor data consent requests with Microsoft 365 Admin Center or PowerShell.
For more details about how to get started, see Build your first Microsoft Graph Data Connect application.
Microsoft 365 data and datasets
Organizations can access various types of Microsoft 365 data via Microsoft Graph Data Connect. Datasets are available from various Microsoft 365 sources, including Microsoft Entra ID, Outlook, Teams, SharePoint, Viva Insights, and Microsoft groups — and the list is growing.
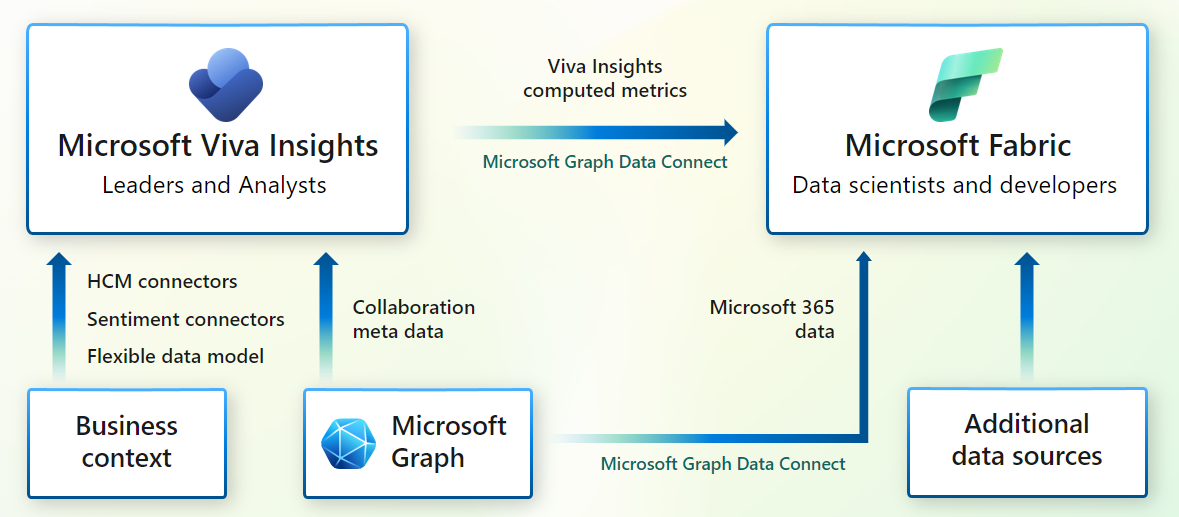
Microsoft 365 datasets come ready for analysis and include the following categories:
- Basic datasets: Datasets generated from raw customer-created content and inputs from Microsoft 365 applications and services.
- Cleaned datasets: Datasets generated by either normalization and de-duplication from basic datasets. This can also include datasets created from user activity or behavior signals in Microsoft 365.
- Curated datasets: Datasets generated for a custom use case or analytics scenario. This category can also include datasets from other Microsoft organizations, such as Viva Insights, SharePoint, and so on. These datasets enable You to extend Microsoft 365 analytics applications.
For a list of Data Connect datasets, see Datasets, regions, and sinks supported by Microsoft Graph Data Connect.
Data Connect templates
Browse through a gallery of templates that provide the necessary Azure resources, data pipelines, and user experience samples to accelerate your path to realizing the value of Microsoft 365 data.
Templates help take use cases from hypothesis to implementation by:
- Aggregating and analyzing large volumes of data within minutes.
- Simplifying development workflows to rapidly build, test, and iterate.
- Automating processes to reduce the need for time-consuming, manual processes.
- Providing data visualizations without the need for complex report configuration.
Security and compliance
Data Connect helps secure Microsoft 365 data by minimizing compliance management overhead for Microsoft 365 administrators.
Choose from these compliance options for your applications that use Microsoft 365 data:
- See persistent data governance in a single view with Microsoft Purview.
- Minimize compliance management overhead by using specified detailed compliance policies for applications and users.
- Follow the industry standard for data privacy and confidentially, with support for critical data protection regulations such as GDPR and HIPAA.
For details, see Security, governance and privacy built into Microsoft Graph Data Connect.
Microsoft 365 data integration
Microsoft Graph Data Connect is integrated with the following Microsoft services with Microsoft 365 data plus:
Microsoft Fabric integration
Now you can bring all your Microsoft 365 data into Microsoft Fabric. Use the Microsoft 365 Data Integration for Microsoft Fabric feature to manage your Microsoft 365 data alongside your other data sources in one place. This solution offers you a suite of analytical experiences that work together to transform your data into a competitive advantage.
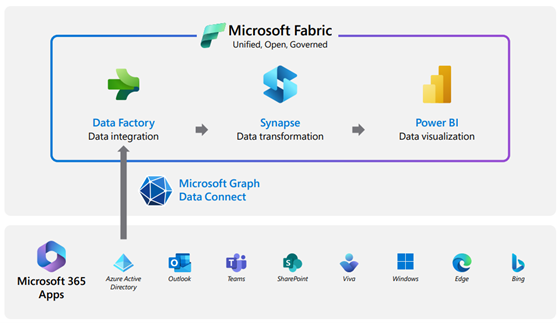
Fabric brings together all these experiences into a unified platform to offer the most comprehensive big data analytics platform in the industry.
- Azure Data Factory: Combines the simplicity of Power Query with the scale and power of Azure Data Factory.
- Azure Synapse: Accelerates time to insight across data warehouses and big data systems.
- Power BI: Ensures that business owners can access all the data in Fabric quickly and intuitively to make better decisions.
To learn more about Microsoft Graph Data Connect integration with Microsoft Fabric, see:
- Microsoft Fabric Launch Digital Event video
- Transform Your Microsoft 365 Data into Business Insights with Microsoft Graph Data Connect
- Microsoft 365 Data + Microsoft Fabric better together blog
Microsoft Graph Data Connect customer and partner stories
Microsoft Graph Data Connect customers build enterprise analytics to empower their organizations.
| Customer | Description |
|---|---|
 |
JLL gives their sales teams a holistic view of client relationships. To learn more, see Microsoft Customer Story-JLL gives sales teams a holistic view of client relationships |
 |
Universities like Politecnico di Milano use Microsoft Graph Data Connect to research actionable workforce sentiment insights. To learn more, see Microsoft Customer Story-Politecnico di Milano delivers actionable workforce sentiment insights |
 |
Companies like Sura are using Microsoft Graph Data Connect to help businesses reduce human resources risk. To learn more, see Microsoft Customer Story-Seguros SURA Latinoamérica to help businesses reduce strategic human resources risk |
 |
G&J Pepsi-Cola Bottlers reflect on overcoming ransomware attacks and offer insights from the other side. To learn more, see Microsoft Customer Story-G&J Pepsi reflects on overcoming a ransomware attack, offers insights from the other side |
Microsoft Graph Data Connect has a rich network of enterprise technology partners who have built powerful solutions with Microsoft 365 data.
| Partner | Description |
|---|---|
 |
GainX builds a comprehensive map of information flow and provides a data-driven, systemic view of how an organization is functioning. To learn more, see Maximizing organizational performance with GainX Artificial Intelligence and Microsoft Graph Data Connect. |
 |
HCL conducts better workforce management, performance analysis, and improvement measures to understand employee productivity. |
 |
Infosys gathers feedback, identifies areas for improvement, and takes action to improve employee engagement, productivity, and retention. |
 |
Lotis Blue utilizes organizational network analysis (ONA) to enhance diversity, equity, and inclusion outcomes. Also applying ONA principles to improve customer relationships and revenue velocity. |
 |
Neo4j constructs security and compliance analytics to uncover the hidden patterns of communication in your organization. To learn more, see Using Microsoft Graph to understand enterprise communication. |
 |
Neudesic extends their Microsoft 365 data and Viva Insights collaboration metrics into the customer’s Azure environment to further display relevant metrics for employees within other systems and portals. |
 |
Parabole illustrates the true cost to maintain the channel, time spent with partners by product, and mismatches between partner investment & partner value. |
 |
TCS identifies patterns and trends in employee behavior during weekends. Gain insights into how weekend working affects overall employee happiness scores. |
 |
Veldhoen facilitates collaboration and connections between various business units within the company as a way to drive innovation. |
 |
Wipro enables their organization to effectively manage and classify data classification during mergers, acquisitions, and divestiture scenarios. |
Pricing
Microsoft Graph Data Connect consumption charges are billed using Azure subscriptions. For details about pricing rates, see Pricing - Microsoft Graph Data Connect.
Read more about the recent Microsoft Graph Data Connect pricing updates.