Dashboard entities
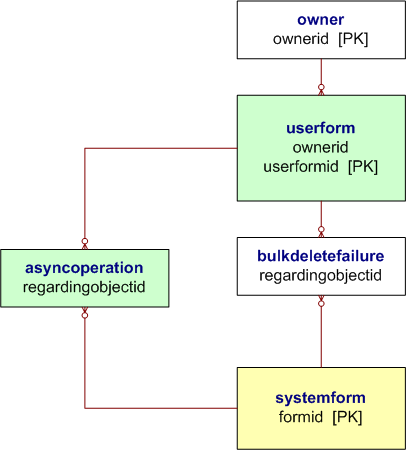
The dashboard entities enable you to simultaneously present data from up to six charts, grids, or IFRAMES. The following illustration shows the entity relationships for this area. More information: Key to Entity Diagrams

Tento prohlížeč se už nepodporuje.
Upgradujte na Microsoft Edge, abyste mohli využívat nejnovější funkce, aktualizace zabezpečení a technickou podporu.
The dashboard entities enable you to simultaneously present data from up to six charts, grids, or IFRAMES. The following illustration shows the entity relationships for this area. More information: Key to Entity Diagrams
