Monitor quality and token usage of deployed prompt flow applications
Important
Items marked (preview) in this article are currently in public preview. This preview is provided without a service-level agreement, and we don't recommend it for production workloads. Certain features might not be supported or might have constrained capabilities. For more information, see Supplemental Terms of Use for Microsoft Azure Previews.
Monitoring applications that are deployed to production is an essential part of the generative AI application lifecycle. Changes in data and consumer behavior can influence your application over time. The changes can result in outdated systems that negatively affect business outcomes and expose organizations to compliance, economic, and reputation risks.
Note
For an improved way to perform continuous monitoring of deployed applications (other than prompt flow), consider using Azure AI online evaluations.
By using Azure AI monitoring for generative AI applications, you can monitor your applications in production for token usage, generation quality, and operational metrics.
Integrations for monitoring a prompt flow deployment allow you to:
- Collect production inference data from your deployed prompt flow application.
- Apply Responsible AI evaluation metrics such as groundedness, coherence, fluency, and relevance, which are interoperable with prompt flow evaluation metrics.
- Monitor prompts, completion, and total token usage across each model deployment in your prompt flow.
- Monitor operational metrics, such as request count, latency, and error rate.
- Use preconfigured alerts and defaults to run monitoring on a recurring basis.
- Consume data visualizations and configure advanced behavior in the Azure AI Foundry portal.
Prerequisites
Before you follow the steps in this article, make sure that you have the following prerequisites:
- An Azure subscription with a valid payment method. Free or trial Azure subscriptions aren't supported for this scenario. If you don't have an Azure subscription, create a paid Azure account to begin.
- An Azure AI Foundry project.
- A prompt flow ready for deployment. If you don't have one, see Develop a prompt flow.
- Azure role-based access controls are used to grant access to operations in the Azure AI Foundry portal. To perform the steps in this article, your user account must be assigned the Azure AI Developer role on the resource group. For more information on permissions, see Role-based access control in the Azure AI Foundry portal.
Requirements for monitoring metrics
Generative pretrained transformer (GPT) language models generate monitoring metrics that are configured with specific evaluation instructions (prompt templates). These models act as evaluator models for sequence-to-sequence tasks. Use of this technique to generate monitoring metrics shows strong empirical results and high correlation with human judgment when compared to standard generative AI evaluation metrics. For more information about prompt flow evaluation, see Submit a batch test and evaluate a flow and Evaluation and monitoring metrics for generative AI.
The following GPT models generate monitoring metrics. These GPT models are supported with monitoring and configured as your Azure OpenAI resource:
- GPT-3.5 Turbo
- GPT-4
- GPT-4-32k
Supported metrics for monitoring
The following metrics are supported for monitoring.
| Metric | Description |
|---|---|
| Groundedness | Measures how well the model's generated answers align with information from the source data (user-defined context.) |
| Relevance | Measures the extent to which the model's generated responses are pertinent and directly related to the given questions. |
| Coherence | Measures the extent to which the model's generated responses are logically consistent and connected. |
| Fluency | Measures the grammatical proficiency of a generative AI's predicted answer. |
Column name mapping
When you create your flow, you need to ensure that your column names are mapped. The following input data column names are used to measure generation safety and quality.
| Input column name | Definition | Required/Optional |
|---|---|---|
| Question | The original prompt given (also known as "inputs" or "question"). | Required |
| Answer | The final completion from the API call that's returned (also known as "outputs" or "answer"). | Required |
| Context | Any context data that's sent to the API call, together with the original prompt. For example, if you hope to get search results only from certain certified information sources or websites, you can define this context in the evaluation steps. | Optional |
Parameters required for metrics
The parameters that are configured in your data asset dictate what metrics you can produce, according to this table.
| Metric | Question | Answer | Context |
|---|---|---|---|
| Coherence | Required | Required | - |
| Fluency | Required | Required | - |
| Groundedness | Required | Required | Required |
| Relevance | Required | Required | Required |
For more information on the specific data mapping requirements for each metric, see Query and response metric requirements.
Set up monitoring for a prompt flow
To set up monitoring for your prompt flow application, you first have to deploy your prompt flow application with inferencing data collection. Then you can configure monitoring for the deployed application.
Deploy your prompt flow application with inferencing data collection
In this section, you learn how to deploy your prompt flow with inferencing data collection enabled. For more information on how to deploy your prompt flow, see Deploy a flow for real-time inference.
Sign in to Azure AI Foundry.
If you're not already in your project, select it.
On the left pane, select Prompt flow.
Select the prompt flow that you created previously.
This article assumes that you created a prompt flow that's ready for deployment. If you don't have one, see Develop a prompt flow.
Confirm that your flow runs successfully and that the required inputs and outputs are configured for the metrics that you want to assess.
Supplying the minimum required parameters (question/inputs and answer/outputs) provides only two metrics: coherence and fluency. You must configure your flow as described in the section for Requirements for monitoring metrics. This example uses
question(Question) andchat_history(Context) as the flow inputs, andanswer(Answer) is used as the flow output.Select Deploy to begin deploying your flow.
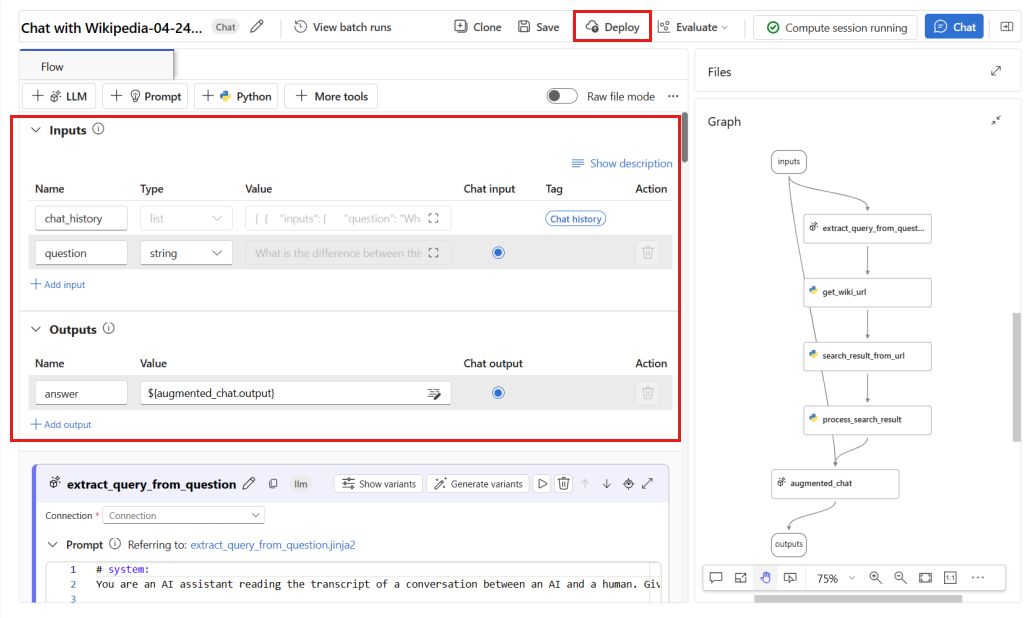
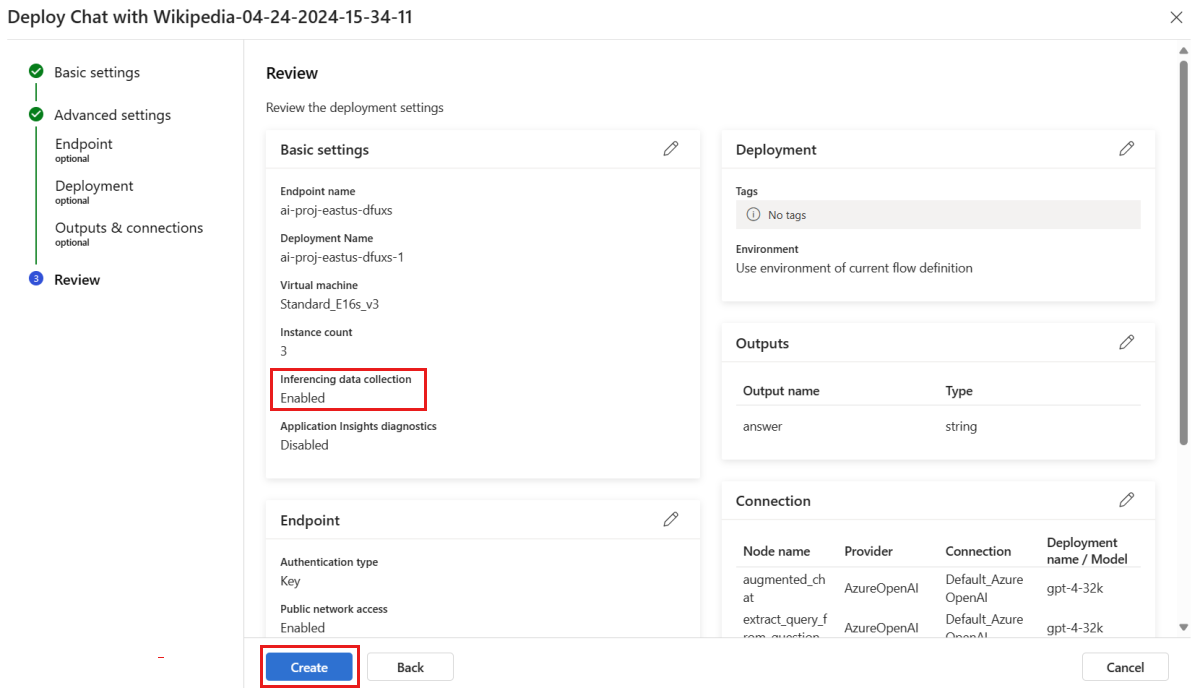
In the deployment window, ensure that Inferencing data collection is enabled to seamlessly collect your application's inference data to Azure Blob Storage. This data collection is required for monitoring.

Proceed through the steps in the deployment window to complete the advanced settings.
On the Review page, review the deployment configuration and select Create to deploy your flow.
By default, all inputs and outputs of your deployed prompt flow application are collected to your blob storage. As users invoke the deployment, the data is collected for your monitor to use.
Select the Test tab on the deployment page. Then test your deployment to ensure that it's working properly.
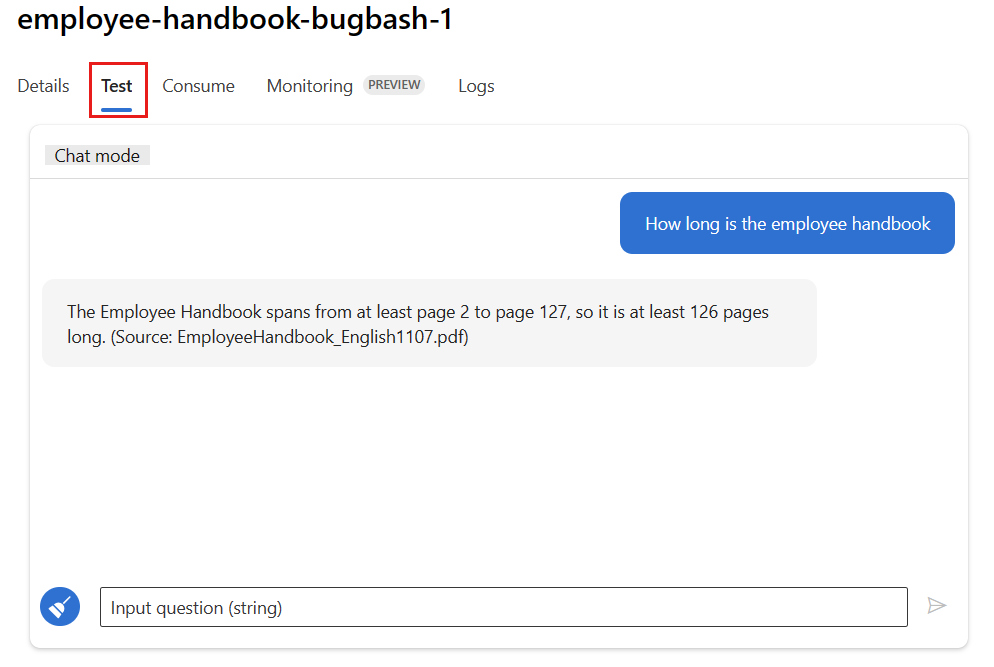
Monitoring requires that at least one data point comes from a source other than the Test tab in the deployment. We recommend using the REST API available on the Consume tab to send sample requests to your deployment. For more information on how to send sample requests to your deployment, see Create an online deployment.


Configure monitoring
In this section, you learn how to configure monitoring for your deployed prompt flow application.
On the left pane, go to My assets > Models + endpoints.
Select the prompt flow deployment that you created.
In the Enable generation quality monitoring box, select Enable.

Begin to configure monitoring by selecting the metrics that you want.
Confirm that your column names are mapped from your flow as defined in Column name mapping.
Select the Azure OpenAI Connection and Deployment values that you want to use to perform monitoring for your prompt flow application.
Select Advanced options to see more options to configure.
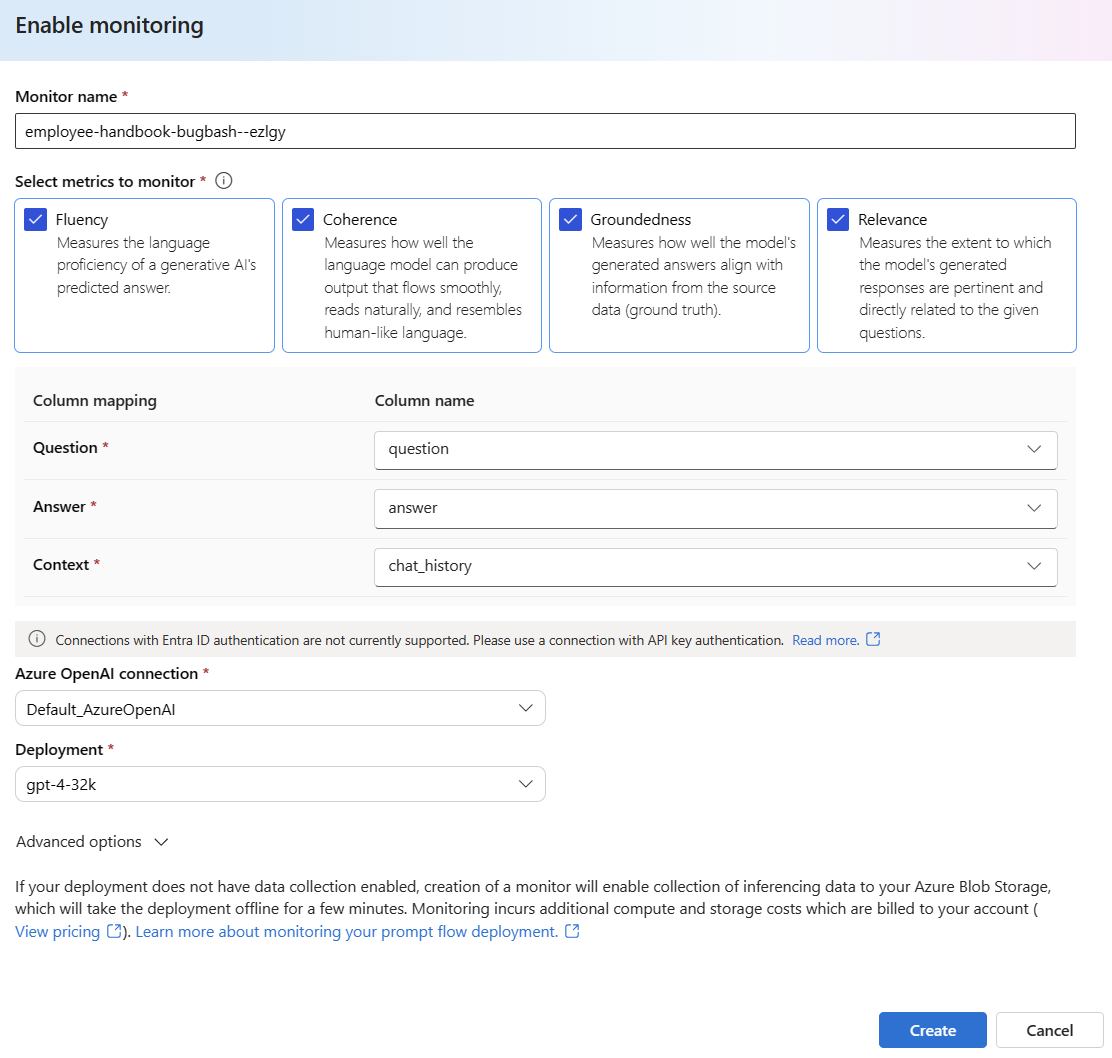
Adjust the sampling rate and the thresholds for your configured metrics. Specify the email addresses that should receive alerts when the average score for a given metric falls below the threshold.

If data collection isn't enabled for your deployment, creation of a monitor enables collection of inferencing data to your blob storage. This task takes the deployment offline for a few minutes.
Select Create to create your monitor.


Consume monitoring results
After you create your monitor, it runs daily to compute the token usage and generation quality metrics.
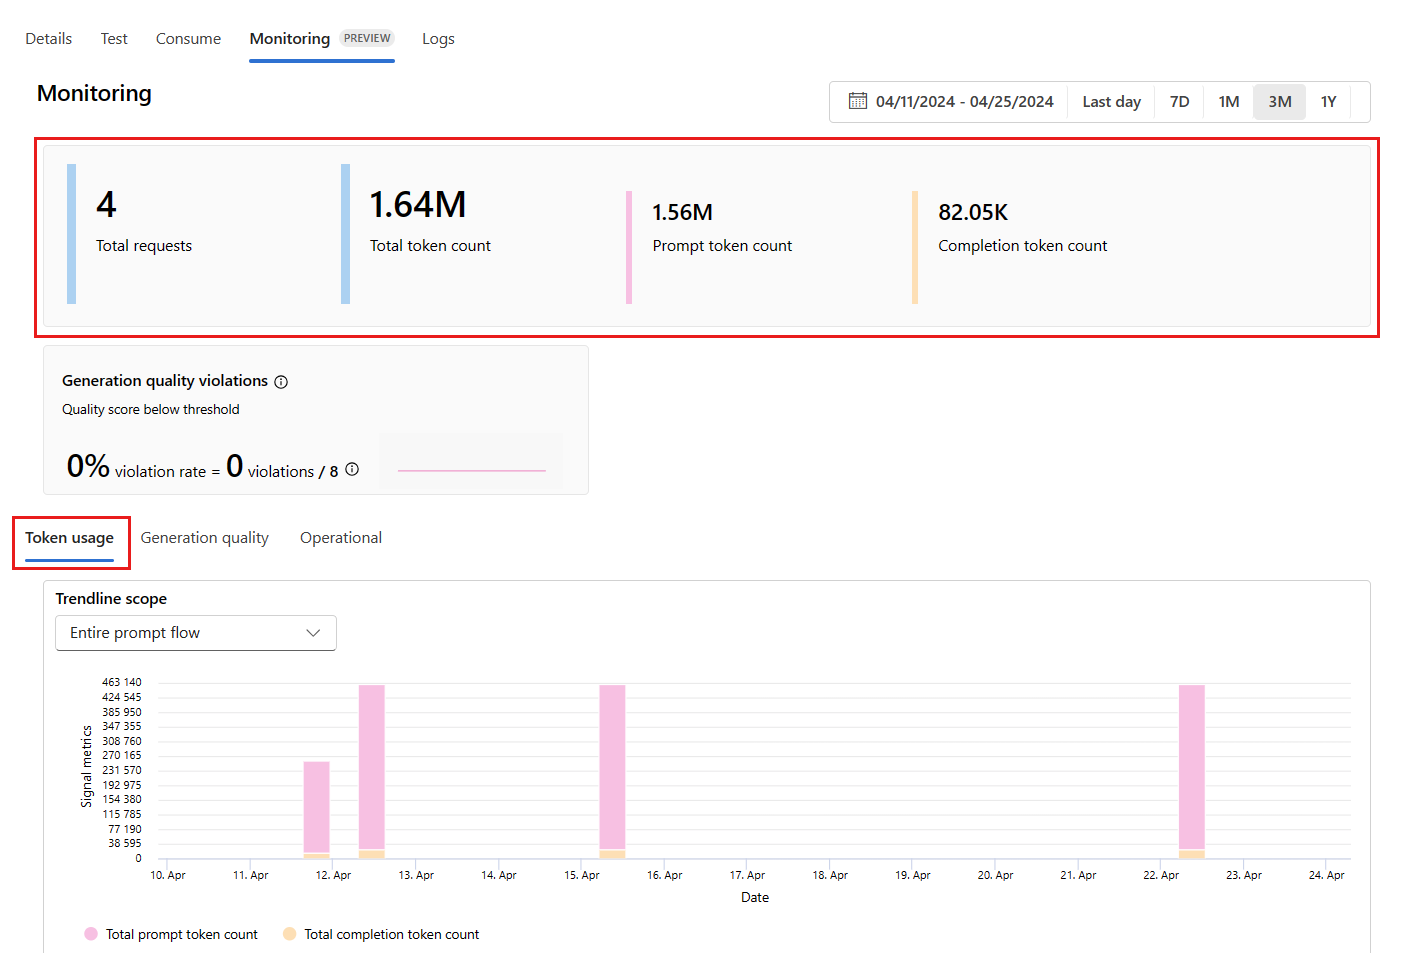
Go to the Monitoring (preview) tab in the deployment to view the monitoring results. Here, you see an overview of monitoring results during the selected time window. Use the date picker to change the time window of data that you're monitoring. The following metrics are available in this overview:
- Total request count: The total number of requests sent to the deployment during the selected time window.
- Total token count: The total number of tokens used by the deployment during the selected time window.
- Prompt token count: The number of prompt tokens used by the deployment during the selected time window.
- Completion token count: The number of completion tokens used by the deployment during the selected time window.
View the metrics on the Token usage tab. (This tab is selected by default.) Here, you can view the token usage of your application over time. You can also view the distribution of prompt and completion tokens over time. You can change the Trendline scope value to monitor all tokens in the entire application or token usage for a particular deployment (for example, GPT-4) used within your application.
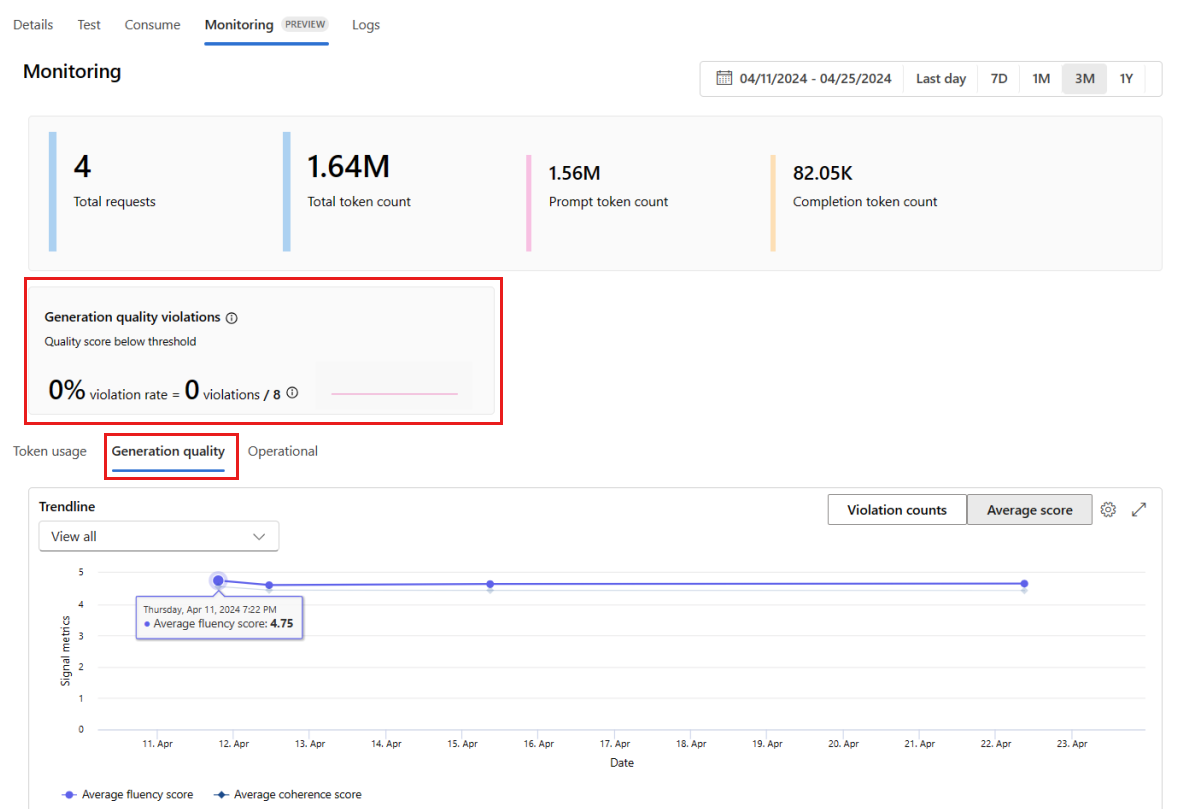
Go to the Generation quality tab to monitor the quality of your application over time. The following metrics are shown in the time chart:
- Violation count: The violation count for a given metric (for example, fluency) is the sum of violations over the selected time window. A violation occurs for a metric when the metrics are computed (default is daily) if the computed value for the metric falls below the set threshold value.
- Average score: The average score for a given metric (for example, fluency) is the sum of the scores for all instances (or requests) divided by the number of instances (or requests) over the selected time window.
The Generation quality violations card shows the violation rate over the selected time window. The violation rate is the number of violations divided by the total number of possible violations. You can adjust the thresholds for metrics in the settings. By default, metrics are computed daily. You can also adjust this frequency in the settings.
On the Monitoring (Preview) tab, you can also view a comprehensive table of all sampled requests sent to the deployment during the selected time window.
Monitoring sets the default sampling rate at 10%. For example, if 100 requests are sent to your deployment, 10 get sampled and are used to compute the generation quality metrics. You can adjust the sampling rate in the settings.
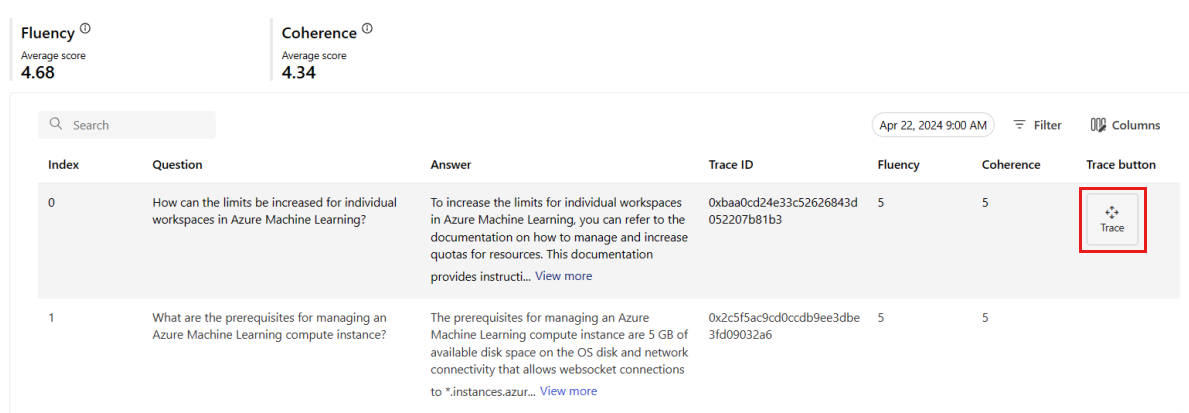
Select the Trace button on the right side of a row in the table to see tracing details for a given request. This view provides comprehensive trace details for the request to your application.
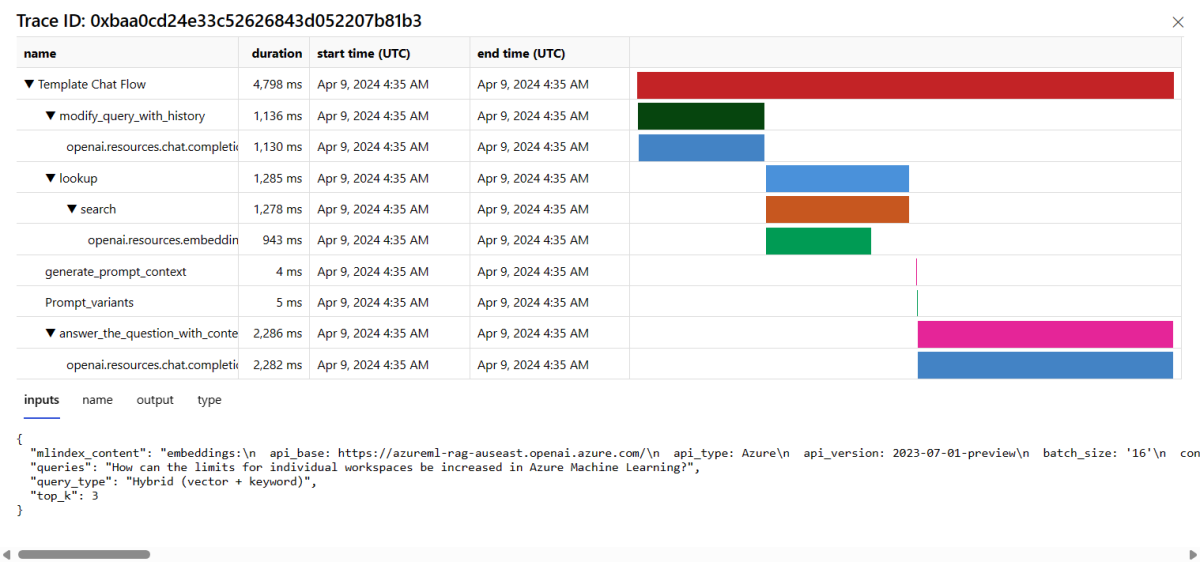
Close the trace view.
Go to the Operational tab to view the operational metrics for the deployment in near real time. We support the following operational metrics:
- Request count
- Latency
- Error rate
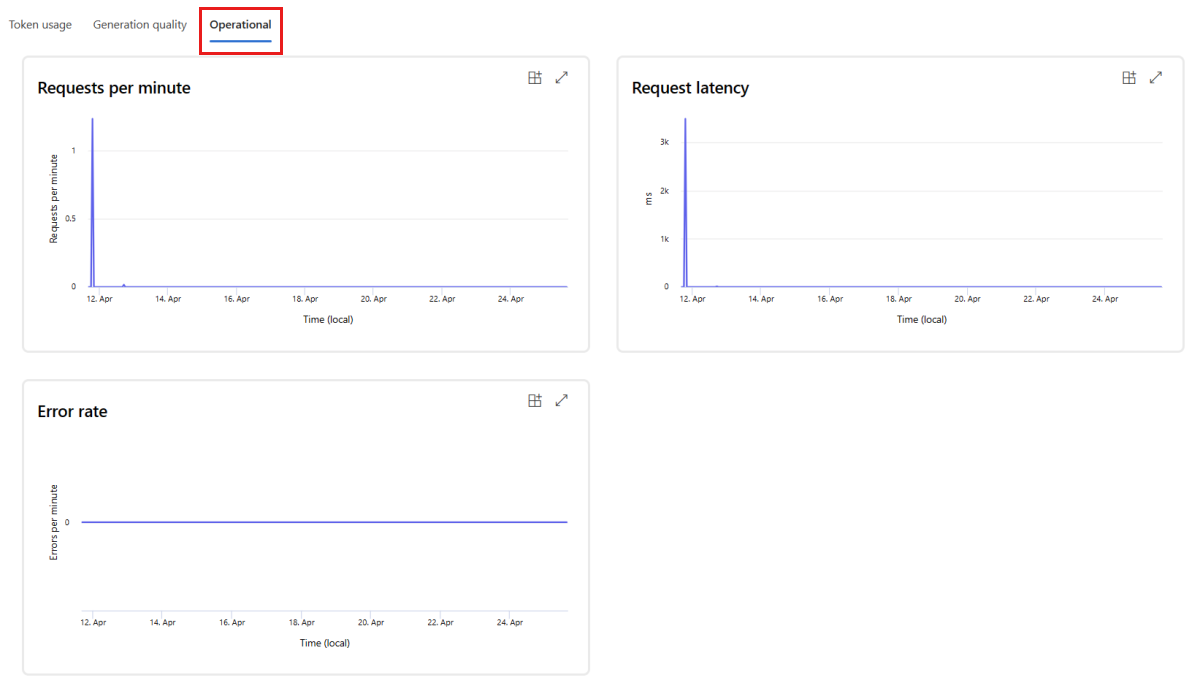


The results on the Monitoring (preview) tab of your deployment provide insights to help you proactively improve the performance of your prompt flow application.
Advanced monitoring configuration with SDK v2
Monitoring also supports advanced configuration options with the SDK v2. The following scenarios are supported.
Enable monitoring for token usage
If you want to enable only token usage monitoring for your deployed prompt flow application, adapt the following script to your scenario:
from azure.ai.ml import MLClient
from azure.ai.ml.entities import (
    MonitorSchedule,
    CronTrigger,
    MonitorDefinition,
    ServerlessSparkCompute,
    MonitoringTarget,
    AlertNotification,
    GenerationTokenStatisticsSignal,
)
from azure.ai.ml.entities._inputs_outputs import Input
from azure.ai.ml.constants import MonitorTargetTasks, MonitorDatasetContext

# Authentication package
from azure.identity import DefaultAzureCredential

credential = DefaultAzureCredential()

# Update your Azure resources details
subscription_id = "INSERT YOUR SUBSCRIPTION ID"
resource_group = "INSERT YOUR RESOURCE GROUP NAME"
project_name = "INSERT YOUR PROJECT NAME" # This is the same as your Azure AI Foundry project name
endpoint_name = "INSERT YOUR ENDPOINT NAME" # This is your deployment name without the suffix (e.g., deployment is "contoso-chatbot-1", endpoint is "contoso-chatbot")
deployment_name = "INSERT YOUR DEPLOYMENT NAME"

# These variables can be renamed but it is not necessary
monitor_name ="gen_ai_monitor_tokens"
defaulttokenstatisticssignalname ="token-usage-signal"

# Determine the frequency to run the monitor, and the emails to recieve email alerts
trigger_schedule = CronTrigger(expression="15 10 * * *")
notification_emails_list = ["test@example.com", "def@example.com"]

ml_client = MLClient(
    credential=credential,
    subscription_id=subscription_id,
    resource_group_name=resource_group,
    workspace_name=project_name,
)

spark_compute = ServerlessSparkCompute(instance_type="standard_e4s_v3", runtime_version="3.3")
monitoring_target = MonitoringTarget(
    ml_task=MonitorTargetTasks.QUESTION_ANSWERING,
    endpoint_deployment_id=f"azureml:{endpoint_name}:{deployment_name}",
)

# Create an instance of a token statistic signal
token_statistic_signal = GenerationTokenStatisticsSignal()

monitoring_signals = {
    defaulttokenstatisticssignalname: token_statistic_signal,
}

monitor_settings = MonitorDefinition(
compute=spark_compute,
monitoring_target=monitoring_target,
monitoring_signals = monitoring_signals,
alert_notification=AlertNotification(emails=notification_emails_list),
)

model_monitor = MonitorSchedule(
    name = monitor_name,
    trigger=trigger_schedule,
    create_monitor=monitor_settings
)

ml_client.schedules.begin_create_or_update(model_monitor)
Enable monitoring for generation quality
If you want to enable only generation quality monitoring for your deployed prompt flow application, adapt the following script to your scenario:
from azure.ai.ml import MLClient
from azure.ai.ml.entities import (
    MonitorSchedule,
    CronTrigger,
    MonitorDefinition,
    ServerlessSparkCompute,
    MonitoringTarget,
    AlertNotification,
    GenerationSafetyQualityMonitoringMetricThreshold,
    GenerationSafetyQualitySignal,
    BaselineDataRange,
    LlmData,
)
from azure.ai.ml.entities._inputs_outputs import Input
from azure.ai.ml.constants import MonitorTargetTasks, MonitorDatasetContext

# Authentication package
from azure.identity import DefaultAzureCredential

credential = DefaultAzureCredential()

# Update your Azure resources details
subscription_id = "INSERT YOUR SUBSCRIPTION ID"
resource_group = "INSERT YOUR RESOURCE GROUP NAME"
project_name = "INSERT YOUR PROJECT NAME" # This is the same as your Azure AI Foundry project name
endpoint_name = "INSERT YOUR ENDPOINT NAME" # This is your deployment name without the suffix (e.g., deployment is "contoso-chatbot-1", endpoint is "contoso-chatbot")
deployment_name = "INSERT YOUR DEPLOYMENT NAME"
aoai_deployment_name ="INSERT YOUR AOAI DEPLOYMENT NAME"
aoai_connection_name = "INSERT YOUR AOAI CONNECTION NAME"

# These variables can be renamed but it is not necessary
app_trace_name = "app_traces"
app_trace_Version = "1"
monitor_name ="gen_ai_monitor_generation_quality"
defaultgsqsignalname ="gsq-signal"

# Determine the frequency to run the monitor and the emails to receive email alerts
trigger_schedule = CronTrigger(expression="15 10 * * *")
notification_emails_list = ["test@example.com", "def@example.com"]

ml_client = MLClient(
    credential=credential,
    subscription_id=subscription_id,
    resource_group_name=resource_group,
    workspace_name=project_name,
)

spark_compute = ServerlessSparkCompute(instance_type="standard_e4s_v3", runtime_version="3.3")
monitoring_target = MonitoringTarget(
    ml_task=MonitorTargetTasks.QUESTION_ANSWERING,
    endpoint_deployment_id=f"azureml:{endpoint_name}:{deployment_name}",
)

# Set thresholds for the passing rate (0.7 = 70%)
aggregated_groundedness_pass_rate = 0.7
aggregated_relevance_pass_rate = 0.7
aggregated_coherence_pass_rate = 0.7
aggregated_fluency_pass_rate = 0.7

# Create an instance of a gsq signal
generation_quality_thresholds = GenerationSafetyQualityMonitoringMetricThreshold(
    groundedness = {"aggregated_groundedness_pass_rate": aggregated_groundedness_pass_rate},
    relevance={"aggregated_relevance_pass_rate": aggregated_relevance_pass_rate},
    coherence={"aggregated_coherence_pass_rate": aggregated_coherence_pass_rate},
    fluency={"aggregated_fluency_pass_rate": aggregated_fluency_pass_rate},
)
input_data = Input(
    type="uri_folder",
    path=f"{endpoint_name}-{deployment_name}-{app_trace_name}:{app_trace_Version}",
)
data_window = BaselineDataRange(lookback_window_size="P7D", lookback_window_offset="P0D")
production_data = LlmData(
    data_column_names={"prompt_column": "question", "completion_column": "answer", "context_column": "context"},
    input_data=input_data,
    data_window=data_window,
)

gsq_signal = GenerationSafetyQualitySignal(
    connection_id=f"/subscriptions/{subscription_id}/resourceGroups/{resource_group}/providers/Microsoft.MachineLearningServices/workspaces/{project_name}/connections/{aoai_connection_name}",
    metric_thresholds=generation_quality_thresholds,
    production_data=[production_data],
    sampling_rate=1.0,
    properties={
        "aoai_deployment_name": aoai_deployment_name,
        "enable_action_analyzer": "false",
        "azureml.modelmonitor.gsq_thresholds": '[{"metricName":"average_fluency","threshold":{"value":4}},{"metricName":"average_coherence","threshold":{"value":4}}]',
    },
)

monitoring_signals = {
    defaultgsqsignalname: gsq_signal,
}

monitor_settings = MonitorDefinition(
compute=spark_compute,
monitoring_target=monitoring_target,
monitoring_signals = monitoring_signals,
alert_notification=AlertNotification(emails=notification_emails_list),
)

model_monitor = MonitorSchedule(
    name = monitor_name,
    trigger=trigger_schedule,
    create_monitor=monitor_settings
)

ml_client.schedules.begin_create_or_update(model_monitor)
After you create your monitor from the SDK, you can consume the monitoring results in the Azure AI Foundry portal.
Related content
- Learn more about what you can do in Azure AI Foundry.
- Get answers to frequently asked questions in the Azure AI Foundry FAQ.