OpsMgr: Testing the Logical Disk Free Space Rate-Of-Change Monitor
(Note: This article was written back in 2011 for OpsMgr 2007 R2 and is now being recreated in OpsMgr 2012 and reposted to this MSDN blog. )
To monitor, detect and alert on sudden and out-of-norm changes (increase or decrease) in free space of a specific drive between sample intervals, the Delta Threshold Windows Performance Monitor type can be utilized to satisfy this requirement.
A custom unit monitor based on this monitor type changes state when the delta in the performance counter calculated over a number of samples exceeds the threshold. (Negative delta means a drop in the performance counter value)
In the previous post on “Monitoring the Rate-Of-Change in Disk Free Space”, the steps to create a custom unit monitor based on the Delta Threshold Windows Performance Monitor type was demonstrated.
This post explores the test results of the Logical Disk Free Space Rate-Of-Change Monitor and discusses how it’s configuration can be modified for other monitoring scenarios.
Scenario 1: Monitoring for an increase of more than 10 % (Percentage box checked) between 2 samples:

As indicated by the performance chart above, when there is more than 10 % increase in the % of Free Space on the C: drive of opsmgr2 between 2 samples, the Logical Disk Free Space Rate-Of-Change Monitor changes state to Critical with the following state change event recorded:

Important Note: The formulae used to calculate the Delta value is: ((Last Value - First Value)/First Value)*100

Hence in this example, the Delta Value exceeds the threshold of 10 %.
Next,

When the changes stabilizes between the next 2 samples, i.e. Delta Value is less than the threshold value, the monitor changes back to Healthy State.

Scenario 2: Monitoring for an decrease of more than 10 % (Percentage box checked) between 2 samples:

Since a negative delta value means a drop in the performance counter value between 2 samples, the configuration of the Logical Disk Free Space Rate-Of-Change Monitor will need to be modified to handle this condition.
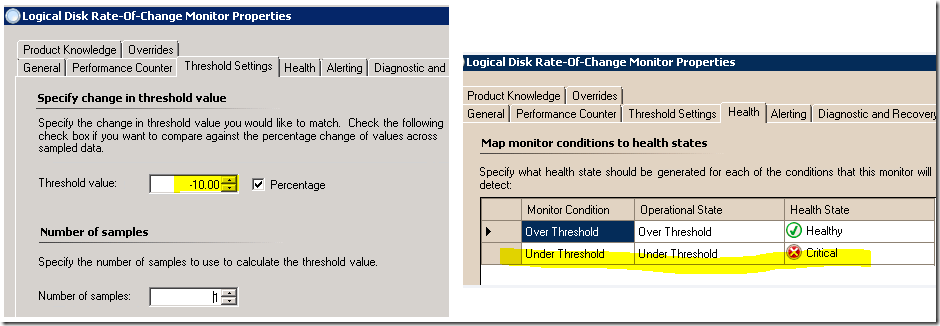
In the Threshold Settings page, the Threshold Value will need to be changed to a negative value. In this example is –10%.
The mapping of conditions to health states will also need to be swapped around as follows, i.e. if the delta value between 2 samples is less than – 10 %, which means that here is a decrease of more than 10 %, therefore change the state of the monitor to Critical state.

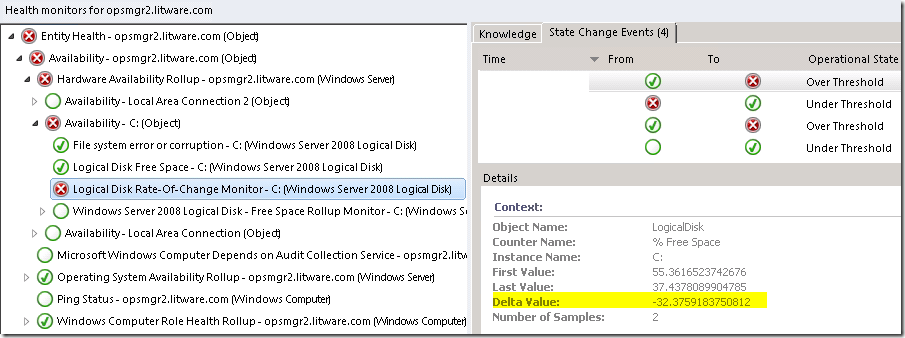
As indicated by the performance chart above, when there is more than 10 % decrease in the % of Free Space on the C: drive of opsmgr2 between 2 samples, the Logical Disk Free Space Rate-Of-Change Monitor changes state to Critical with the following state change event recorded:

Again, the formulae used to calculate the Delta value is as follows, hence in this example, the Delta Value exceeds the threshold of 10 %.

Next,

When the changes stabilizes between the next 2 samples, i.e. Delta Value is more than the threshold value, the monitor changes back to Healthy State.

Scenario 3: Monitoring for an increase of more than 10 points (Percentage box unchecked) between 2 samples:

Since the comparison is now made against the current values between the 2 samples instead of the percentage between them, the configuration of the Logical Disk Free Space Rate-Of-Change Monitor will need to be modified to handle this condition.
In the Threshold Settings page, the Percentage checkbox will need to unchecked to set the threshold value to 10 points instead of 10% , for this example.
The mapping of conditions to health states will also need to be configured as follows, i.e. if the delta value between 2 samples is more than 10 point, which means that here is an increase of more than 10 points, therefore change the state of the monitor to Critical state.

As indicated by the performance chart above, when there is more than 10 points increase in the % of Free Space on the C: drive of opsmgr2 between 2 samples, the Logical Disk Free Space Rate-Of-Change Monitor changes state to Critical with the following state change event recorded:

Important Note: The formulae used to calculate the Delta value is now more straight forward and just = (Last Value - First Value)
When the changes stabilizes between the next 2 samples, i.e. Delta Value is less than the threshold value, the monitor changes back to Healthy State.

Some Findings:
Comparing against the percentage change of values across sampled data is a more effective way of monitoring the rate-of-change between multiple samples as the Delta Value is also calculated based on the First and Last Values and hence relative to the range of the values between the 2 samples.
