OpsMgr: Sample OS Summary Dashboard with “Blue Bar” Columns
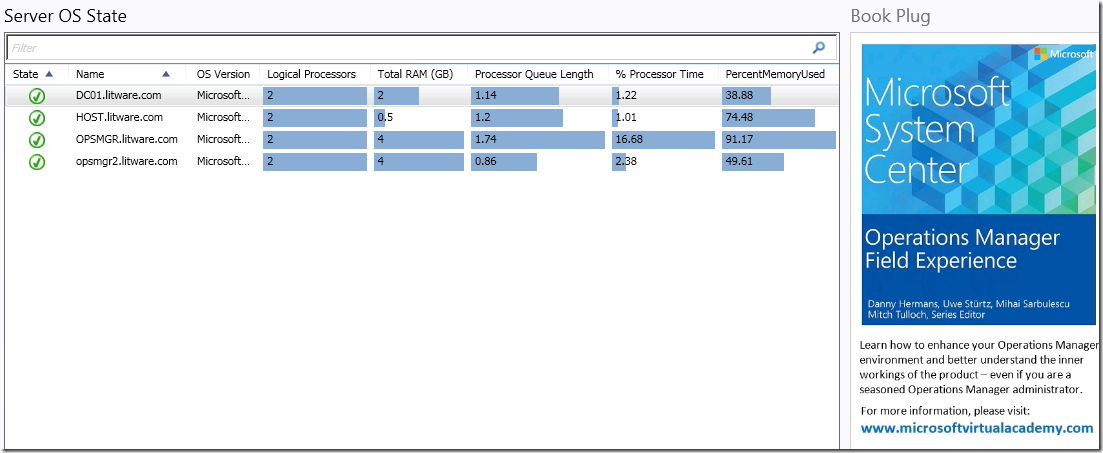
This article features a sample summary dashboard for the server OS with custom - “Blue Bar” columns to visually identify maximum and minimum values of metrics: % Performance Time, Processor Queue Length, Percent Memory Used, number of Logical Processors and Memory. Each column displays a value and its ranking (in a blue bar) per row with respect to the other values from other rows of the same column.
I also added a book plug with this summary dashboard to help spread the word about this free e-book:
Microsoft System Center Operations Manager Field Experience, authored by Danny Hermans, Uwe Stürtz, Mihai Sarbulescu with Mitch Tulloch as Series Editor.
“Learn how to enhance your Operations Manager environment and better understand the inner workings of the product – even if you are a seasoned Operations Manager administrator. If you are responsible for designing, configuring, implementing, or managing a Microsoft System Center Operations Manager environment, this e-book is for you.”
For more information, please visit here.
The e-book can be downloaded from the Microsoft Virtual Academy here.
The management pack bundle (MPB) for this Sample OS Summary Dashboard can now be downloaded from the TechNet Gallery.

The key component used here to generate the custom columns with “Blue Bars” per row is the “Microsoft.SystemCenter.VMMHostVM.Visualization.Components.Common.DataObjectColumnGenerator" component defined in the Microsoft System Center Management Pack for VMM Host and VM Dashboards Visualization Components management pack (Microsoft.SystemCenter.VMMHostVM.Visualization.Components).
This component is used within the VMM Host Dashboard for the Hosts state widget. This widget supports filtering and sorting by any column. “Blue bar” columns allows to visually identify maximum and minimum values. Performance metrics in respective columns indicate the average metrics’ value over the selected interval.
Here’s an example of what the VMM Host Dashboard looks like ( from System Center 2012 R2 Virtual Machine Manager Host and Virtual Machine Dashboard Management Pack ; Current Version: 1.1.41.91 ):

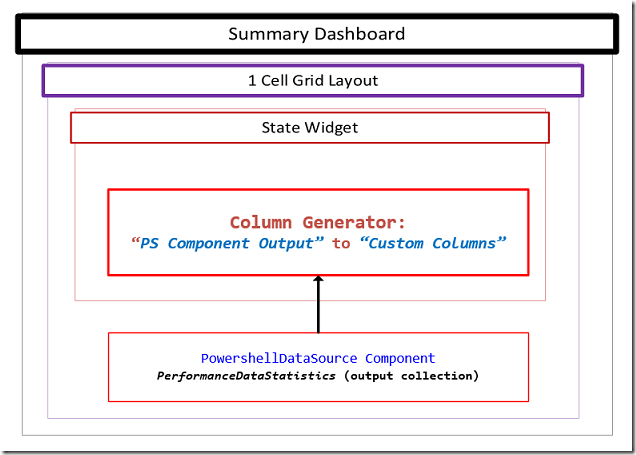
Here is a logical representation of the sample summary dashboard composition:

Here is the PowerShell script used in the PowerShell Datasource component to retrieve the average performance stats for % Performance Time, Processor Queue Length and Percent Memory Used; and values of Logical Processors and Physical Memory properties for the selected Windows Server OS object, convert results to “PerformanceDataStatistics” type and return the collection to the VMM column generator component of the State Widget:
#////////////////////////////////////////////////////////////////////////////////////////////
$class = get-scomclass -Name Microsoft.Windows.Server.OperatingSystem
$serverOSes = Get-SCOMClassInstance -class $class
$avg_stat = @{}
$dataObjects = @()
$unitReplacements = @{
"Physical Memory (MB)" = @{ "name" = "Total RAM (GB)"; "coeff" = 1048576 };
}
#///////// Functions Section ///////////////////// START
function RecalculateMinMaxForAvgStatItem
{
param($name, $value)
$avg_stat[$name]["min"] = ($avg_stat[$name]["min"], $value | Measure -Min).Minimum
$avg_stat[$name]["max"] = ($avg_stat[$name]["max"], $value | Measure -Max).Maximum
}
# Function to convert results to “PerformanceDataStatistics” type to return the collection to the VMM column generator component of the State Widget:
function CreateStatistics {
param($value)
$stat = $ScriptContext.CreateInstance("xsd://Microsoft.SystemCenter.Visualization.Library!Microsoft.SystemCenter.Visualization.DataProvider/PerformanceDataStatistics")
if ($value -ne $null) {
$stat["AverageValue"] = [double]$value
$stat["Value"] = [double]$value
}
$stat
}
# Initialize Stat Item:
function InitAvgStatItem {
param($name)
if ($avg_stat[$name] -eq $null) {
$avg_stat[$name] = @{}
$avg_stat[$name]["min"] = 0
$avg_stat[$name]["max"] = [Int32]::MinValue
}
}
function AddColumnValue {
param($dataObject, $name, $value)
$v = $value
# Transform units value
if($unitReplacements[$name] -ne $null) {
$r = $unitReplacements[$name]
if ($v -ne $null) {
$v = $v = $v / $r["coeff"]
}
$name = $r["name"]
}
InitAvgStatItem $name
if ($v -ne $null) {
$dataObject[$name] = CreateStatistics($v)
RecalculateMinMaxForAvgStatItem $name $v
}
else
{
$dataObject[$name] = $null
}
}
#///////// Functions Section ///////////////////// END #///////// Main Section ///////////////////// START
foreach ($serverOS in $serverOSes) {
$dataObject = $ScriptContext.CreateFromObject($serverOS, "Id=Id,State=HealthState,Name=Name", $null)
$dataObject["Name"]=$serverOS.Path
$dataObject["OS Version"]=$serverOS.DisplayName
if ($dataObject -ne $null) {
#Get values of Logical Processors and Physical Memory properties:
$properties = @('LogicalProcessors', 'PhysicalMemory')
$properties | % {
$prop = $serverOS."[Microsoft.Windows.OperatingSystem].$($_)"
AddColumnValue $dataObject $prop.Type.DisplayName $prop.Value
}
#Last 16 hours
$aggregationInterval = 16
$dt = New-TimeSpan -hour $aggregationInterval
$now = Get-Date
$from = $now.Subtract($dt)
$perfRules = $serverOS.GetMonitoringPerformanceData()
foreach ($perfRule in $perfRules) {
#Get % Processor Time Stat
if($perfRule.CounterName -eq "% Processor Time") {
$data = $perfRule.GetValues($from, $now) | % { $_.SampleValue } | Measure-Object -Average
AddColumnValue $dataObject $perfRule.CounterName $data.Average
}
#Get Processor Queue Length Stat
if($perfRule.CounterName -eq "Processor Queue Length") {
$data = $perfRule.GetValues($from, $now) | % { $_.SampleValue } | Measure-Object -Average
AddColumnValue $dataObject $perfRule.CounterName $data.Average
}
#Get % Memory Used Stat
if($perfRule.CounterName -eq "PercentMemoryUsed") {
$data = $perfRule.GetValues($from, $now) | % { $_.SampleValue } | Measure-Object -Average
AddColumnValue $dataObject $perfRule.CounterName $data.Average
}
}
$dataObjects += $dataObject
}
}
foreach ($dataObject in $dataObjects)
{
foreach ($metric in $avg_stat.Keys)
{
$stat = $avg_stat[$metric]
$dataObject[$metric]["MinimumValue"] = [double]$stat["min"]
if ($stat["max"] -ne [Int32]::MinValue)
{
$dataObject[$metric]["MaximumValue"] = [double]$stat["max"]
}
else
{
$dataObject[$metric]["MaximumValue"] = [double]0
}
}
$ScriptContext.ReturnCollection.Add($dataObject)
}
#///////// Main Section ///////////////////// END
#////////////////////////////////////////////////////////////////////////////////////////////
When the sample MP is imported into a OpsMgr 2012 environment, the summary dashboard will appear at the root of the Monitoring Workspace with display name as: Sample Custom Column Dashboard:

When selected, a summary dashboard that looks similar to the following example will be displayed:

For more information about OpsMgr 2012 Dashboard Component Types and Implementations,
Go to: https://social.technet.microsoft.com/wiki/contents/articles/18657.operations-manager-management-pack-authoring-dashboards.aspx
Thank you for your support !
Disclaimer:
All information on this blog is provided on an as-is basis with no warranties and for informational purposes only. Use at your own risk. The opinions and views expressed in this blog are those of the author and do not necessarily state or reflect those of my employer.
Comments
Anonymous
May 31, 2015
Genius!Anonymous
May 31, 2015
Nice work Wei, as usual :-)Anonymous
June 01, 2015
Very helpful dashboard. But makes me wonder why the big book plug? Its blocking the view..Anonymous
June 03, 2015
Great Stuff!Anonymous
August 26, 2015
hi wei, this is great, but we have a huge number of servers, how can i target this to just a specific group, or even better be able to choose a group and have a dashboard populate for it?Anonymous
April 07, 2016
I tried installing this however received this error:"The dependencies for this management pack cannot be located."- Anonymous
April 08, 2016
The comment has been removed
- Anonymous